


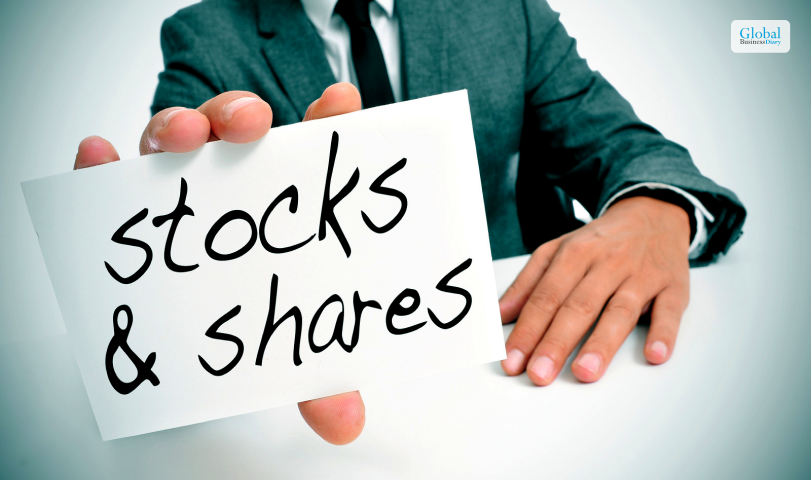
The Comparison of Stock Vs. Share: Definition, Significance and Values
Shares are the units used to measure your ownership in a company. Many articles use the terms stocks and shares to mean the same thing. However, there are some fundamental differences between stock vs. share.
When you purchase a stock, it works as a certificate. It shows that you have ownership in a company.
Let me clarify the difference between stock vs. share in simple terms. Take the instance where a company lists its stocks. You buy ten shares of that stock. Each share is equivalent to 1% of your ownership.
But don’t mistake it for 1% ownership in the company.
In easier terms, you don’t buy stock. You purchase shares of that stock.
An understanding of stocks and trading are the basics of investment. First, learn these in detail. Then, start investing. You must understand the difference between the two to make informed decisions while buying and selling shares.
Stocks

Stocks come first. Then shares. You can only buy shares if its stock is listed on the share market.
Definition Of Stocks
In simple terms, investors use the term stocks to denote the companies listed on the stock market. For example, you can refer to energy, large, or mid-cap stocks.
Investopedia defines stocks as:
“a kind of security that suggests the holder has proportionate ownership in the stock issuing corporation and is sold mainly on stock exchanges.”
You can also define a stock as a share percentage to reflect your ownership in the company.
Represent Ownership in a corporation
If you buy a stock, you get part ownership of the issuing company. An individual or entity with the highest shares of a listed company is its primary owner.
To understand stock vs. share, consider yourself a part-owner of a company. In 2023, the NYSE had 2272 listed companies.
You could buy stock from any of these companies.
Claim On Earnings and Assets
Every shareholder has a statutory claim on the company’s assets. If you buy one share of Starbucks for $73.50, that money goes into the company’s total assets. So, when Starbucks profits or gives dividends to its investors, you also get a part of it.
However, your earnings are not in terms of money gained. Starbucks’ share price value will increase if it gives dividends or shares profit. For evidence, you bought one share for $73.50. After that, Starbucks shared its dividend, and the share price became $75.00 (arbitrary).
Payment Of Dividends
Most US companies share dividends every quarter. For evidence, Starbucks shares a $0.57 dividend per share. Here, there is no confusion about stock vs. share.
You gain per share, not per stock. The earnings are shared quarterly. When the dividend is disbursed, it is reflected in your share price value. Make sure to distinguish stock vs. share here.
You will count your earnings on each share.
Example: Owning Stock in Apple
Apple is a stable brand on the NASDAQ. Apple’s current share price is USD 182.74.
Like Starbucks, Apple also gives dividends every quarter. Apple increased its dividend by 4%. In cash, it was $0.25.
The shareholders will get their dividends on 16th May 2024 for the current quarter.
Shares

Now you know about stocks in detail. But what about shares?
Shares are the actual tradable units of stock. Like I said, you can only buy part of the stock. However, you purchase “n” number of shares of a stock. Now, you should not have any ambiguity about stock vs. share.
Definition Of Shares
Shares refer to part ownership in a company. Ay, the company can list a fixed number of shares in the market. Currently, AAPL has 15,509,763,000 outstanding shares in the market.
There are mainly two types of shares. These are:
- Equity shares
- Preference shares
A company gets funds from the market by issuing shares. However, you get an ownership stake in the organization when you buy shares.
Individual Units of Stock
Still need clarification on what shares are? To clarify stock vs. share, I can describe shares as units of equity ownership of a company in the market.
A company will share any surplus profit as dividends to the open market.
Every unit of stock has a fixed value. If the company profits, then you get additional dividends. As a result, you enjoy monetary gain. However, you will incur losses if the company loses the money invested by shareholders.
Convey Information About Investment Size
The number of shares denotes your investment size. If you say you have AAPL stocks, nobody will understand the net worth of your investment in the company.
For instance, you can buy shares in Apple. After that, you and Warren Buffett (who have maximum shares) will be both Apple stockholders and part owners of the tech giant.
But your investment size is different. According to Fool.com, Warren Buffett had 906 million company shares in 2023 (now 790 million). So, he will earn much more than you when Apple gives dividends to their shareholders.
Example: Owning 100 Shares of Apple
Currently, Apple (AAPL on NASDAQ) is trading at USD 182.74. It means that the value of a unit share of Apple’s stock is the same.
If you buy 100 shares, you will pay:
182.74*100= USD 18274.0
The last dividend given by Apple is $0.24 for each share. So, if you bought 100 shares, you gained $0.24*100= $24.00.
Stake

Most people confuse stock with shares. Stake is the term used to define the relationship between shares and stocks. I have shared essential knowledge about stakes here.
Definition Of Stake
A stake is the amount an investor gives in exchange for a company’s stock. If you have shares in a company, you also hold a particular stake in the firm.
Represents Ownership Percentage In A Company
Warren Buffett had around 905 million shares of Apple in 2023. It means that he should have a good stake in the company. If you hold a few shares, then it cannot be calculated in terms of percentage. However, that many shares are equivalent to a 6% stake in Apple.
It is also the ownership percentage of Warren Buffett’s company, Apple. The current valuation of the stake is $174 billion currently.
Not Limited to Stock Ownership
The stake is a broad term. It is not only used to measure the percentage of stocks of a company that you own. You can use the term to denote your percentage of ownership in any asset. For example, you can have a stake in an investment property.
Stockholders, Shareholders, and Stakeholders

Now you know what stock vs share are. You also know the meanings of stocks, shares, and stakes. If you invest in any company, you are its stockholder.
If you have “n” number of shares of any stock, you can call yourself a shareholder.
Again, stakeholders have a certain percentage of the stock issued by a company in the share market. In a common context, these terms can be used interchangeably.
These three can be used to refer to the same person. However, there is a slight difference. Warren Buffett has a 6% stake in Apple. His percentage is significant because he has 790 million shares. So, you can imagine your stake will not be fathomable if you have a handful of shares.
Stakeholders Have a Financial Interest in a Business
When you have invested in so many shares, you will earn a lot if the company profits. Similarly, you will lose big time if the company goes into losses.
John T. Walton Estate Trust, Vanguard Group, and BlackRock hold the highest shares of Walmart. So, it will matter to them if Walmart gains or loses money.
Conclusion
I hope the confusion of stock vs. share will end now. If you own a stock, it means you are the certified owner of “n” number of shares in a company.
You can understand a stock as the instrument used by a company to trade in the market. Again, shares are single units of stock in the market.
You are the sole owner of a company if you are the sole owner. At the same time, the person or entity with the highest stock is also a part owner.
The difference is that he will gain more than you. In simple terms, both of you will gain a certain dividend on each share. The person with higher shares (of the same company) will earn more. You must understand the three terminologies clearly to make a more informed choice in the share market. I hope this article solved your confusion about stock vs. share.
#Disclaimer: The information provided on this blog is for educational and informational purposes only and should not be construed as financial advice. I am not a licensed financial advisor. Any investment decision you make is at your own risk, and you should consult with a qualified financial advisor before making any investment decisions. This site may contain affiliate links, and I may earn a commission at no additional cost to you.
Read More Interesting Business Articles By Clicking Below!!

Recent
Where Distributors Lose Profit Without Realizing It
Jun 20, 2026

Building Better Warehouse Traffic Flow Through Operational Design
Jun 20, 2026

Debtor Ghosting You? Here’s How to Collect the Debt Fast And When to Hand It to Taurus Collections
Jun 09, 2026

Reducing Micro-Defects in Medical Manufacturing
May 18, 2026

Related Articles

The Importance Of Research In Making Investment Decisions
Making sound investment decisions is all about having the correct information. Whether Investing In Stocks, bond guarantee, mutual funds, or other financial products, understanding the fundamentals and researching your options thoroughly can make a big difference between success and failure. Researching potential investments not only arms you with knowledge but also allows investors to have deeper insights that go beyond simply evaluating commodity prices or past performance – something which will ultimately determine whether an investment decision is successful. This article will examine why research plays a vital role in making intelligent investments. What is the investment's purpose? As investors, we must understand the importance of conducting thorough research before making significant investment decisions. Whether our investment goal is to generate income or to build wealth, it is critical to undertake proper market analysis and feasibility studies. Without proper research, we risk investing in stagnant or declining markets, which leads to losses rather than gains. Research helps identify investment opportunities that align with our investment objectives and highlight risks and limitations that may impact our investment outcomes. By being diligent in our research, we can make informed decisions that increase the likelihood of success in our investment endeavors. ADSS.com has various research tools available to help investors make more informed decisions. What are the associated risks? Making investments requires an understanding of the associated risks. Researching investments helps us to assess the risk associated with a particular asset class or security, allowing us to make more informed decisions and reduce our exposure to losses. However, if you have got the assistance of investment research services, there is absolutely nothing to worry about! Research can also help investors identify opportunities and mitigate risks by diversifying portfolios across different asset classes. Investing in multiple securities reduces volatility and allows for more stable returns. Diversification is one of the essential principles of investing, and research can play a vital role in helping investors strike this balance when building their portfolios. Is the investment suitable for your goals and needs? Investing is a personal endeavor, so it is crucial to ensure that the investments you choose suit your circumstances. Research can help investors determine whether a particular investment would suit them by considering risk tolerance and financial goals. This process requires further research into areas such as the historical performance of a security or asset class; its expected returns; associated fees and costs, and other factors that influence our decision-making. Ultimately, when researching potential investments, investors should strive to answer questions such as: Does this meet my goals? Can I afford it? What is the track record of the company or fund you are considering investing in? Understanding the track record of an asset class, fund, or company is essential for making an informed decision. Researching the performance history and risk profile of a security or other investment vehicle can provide insights into its past successes and any red flags that may signal potential risks. Researching the management team behind a company or fund can also be beneficial to get a better idea of their strategy and expertise. Additionally, investors should pay attention to news stories about their investments to stay informed on their performance in the market. All these factors can help investors make more educated decisions when investing their money. What is the historical performance of the asset class? Historical performance is a crucial consideration when researching potential investments. It provides insight into the long-term trend of an asset class, allowing investors to identify patterns and understand its risk profile. This information can be used to make more informed decisions on which assets to invest in and when. Analyzing past performance can also reveal any red flags that may have been overlooked during the initial research stage. By taking this extra step, investors can reduce their chances of losses due to unexpected events or market downturns. ADSS.com's historical data tools provide detailed insights into the track record of different asset classes and securities, helping investors make smarter investment decisions. What are the potential returns, and what kind of volatility should you expect? Investors should consider their expected returns and the associated risks when researching potential investments. Understanding the volatility of an asset class can help inform investors on how to allocate their capital and manage their portfolios over time. It is important to note that past performance does not guarantee future results, but it can provide valuable insights into an investment's potential returns and risk profile. Additionally, researching fees and costs related to a particular security or fund can help determine if the return justifies the cost. Finally, when investing in stocks, it is vital to understand which companies are behind them and what kind of management team they have in place; this will give you a better sense of the company's prospects in the future. Read Also: BNKU Stock: MicroSectors US Big Banks Index 3X Leveraged ETNs 10 Best Investment Apps For 2021 – Globalbusinessdiary Is An Investment Banker A Good Career Choice?
Apr 20, 2023

Simple Tips To Diversify Your Stock Portfolio
It’s no secret that investing a percentage of your income in stocks and index funds is sound financial practice. Not only do these investment vehicles help you generate wealth, but they can also help you weather the storm of inflation and other negative external forces. You must work to diversify your stock portfolio If you’re responsible for a family, you should prioritize building enough income streams to support your household. And while investing is sound practice, it’s not entirely foolproof. It can backfire if you put all your eggs in one basket. Most novice investors do end up losing money after making a series of poor investment decisions. To combat the risk of losing all your investment capital with an underperforming company, many seasoned investors would encourage others to diversify their stock portfolio. This management strategy helps mitigate the risk of stock crashes from severely impacting your portfolio. Unsure of how to properly diversify your stocks for the best outcome? The good news is that there are ways you can grow your financial assets with as little risk as possible. Here are five simple tips on diversifying your stock investments and taking your portfolio to the next level. Start With Conservative Stocks While it can be tempting to ride whatever hyped-up stock is topping the market today, it’s important to be rational throughout the whole process. Hyped-up stocks may turn in a quick buck, but their sustainability over time is questionable at best. In other words, avoid letting your emotions get ahold of you, especially if you’re planning to invest a sizeable chunk of your savings. One thing we’d suggest is for novice investors to start with low-risk stocks. Don’t know what these stocks are? Well, think of stocks owned and provided by financially stable companies. Think of companies that make up the Fortune 500, or the equivalent big-shots in your country. Ensure that these companies’ stocks have satisfactory results when analyzing their fundamentals and technicals. These stocks may be slower-than-average when it comes to growth potential, but they’re relatively low-risk and safe investments to make. Having conservative stocks act as the foundation of your portfolio can help ensure that you won’t experience unexpected, sharp losses in the future. Low-risk stocks tend to be found in developed industries like healthcare and utilities. HALO Technologies spotlight on CSL provides good insights into one of Australia’s renowned biopharmaceutical companies. Ideally, you should pick a main stock that comes from a financially stable industry and company, and those that have good fundamentals and technicals. Choosing a stock with a stable dividend payment history is also a green flag as it shows the company’s commitment to provide value to their shareholders. Invest In Stocks With Different Market Cap Once you’ve allocated a good portion of your money into stable stocks, you can then toy around with high-risk and high-growth ones. A good way to tell these stocks apart is by looking at their market capitalization. Market capitalization refers to the current stock value of a company multiplied by the number of present shares in the market. Using that formula, stocks can be divided into three categories: large-cap stocks, small-caps and mid-caps. A large-cap stock is typically valued above $10 billion. Well-established and reputable companies make up this category. Mid-cap stocks are companies between $2 billion to $10 billion, while small-cap stocks are valued below $2 billion. The lower the company’s market cap, the more volatile they are considered. That said, small-cap companies tend to hold characteristics that make them more likely to yield significant returns. This is especially true if they’re a newer company with fast growth potential. If you want to diversify your stock portfolio, be sure to pick stocks in all three categories. This way, you can get a good, eclectic mix of investments that can experience both growth and stability. Diversify With International Stocks It’s not uncommon for major shifts in one country’s geopolitical and economic situation to greatly affect the public stocks of companies based in that country. This can impact businesses of all sizes, regardless of the industry. For instance, the Russian-Ukranian war has led to reduced spending and investment in both American and Russia-based companies. This is due to sanctions, investor uncertainty, reduced spending capacity, and a whole lot of other external factors. While the stock movements of most countries have ties with one another, only a few would bear most of the brunt. And investors won’t always be able to predict who will instigate the next major maelstrom that’ll sweep the global economy into the next arc of instability. As such, it’s important to diversify your stocks in companies that come from different countries. Holding stocks from companies from the European Union and Australia are good options as these places tend to be less politically turbulent. Plus, many technological and global firms are starting to become more prevalent in these regions. US and Chinese markets are also still worth investing in to offer your portfolio some balance. These countries also hold some of the world’s largest and fastest-growing companies, so they’re not exactly bad options to consider either. Read Also: What You Should Consider Before Investing In Healthcare Company Stocks Consider Index Funds If you don’t have the time or passion to research the best stocks to invest in, you can consider diversifying by putting your money into index funds instead. Index funds are market indices that include a wide range of stocks that follow a broad market segment. Examples of index funds include the S&P 500 in the US and ASX 200 in Australia. Investing in these funds means you’re essentially putting money in all the stocks covered by the fund itself. This makes them a more efficient option for investors who want to invest in multiple stocks but don’t want to be the primary selectors of these stocks. This investment option is an excellent choice for both novice and experienced investors, offering a good balance of growth and stability by reflecting the market’s movements in a parallel fashion. That said, if the market is underperforming, you’re also risking losing a fraction of your investment’s value—so be strategic with your decision. Invest In Multiple Sectors Industries often experience different stages of growth and decline. For instance, the pandemic has caused stagnation in the tourism sector, but it’s starting to rise again after a few years. Industries like technology have been on the up and up for decades. It’s a cyclical process. Investing in sectors that represent different parts of the economy is a good way to diversify your stock portfolio. As respected as some industries are, you don’t have to go all-in on healthcare and technology. Put a bit of capital on consumer goods, energy, and finances too. By investing in different sectors, you can smooth out volatility and potentially experience high returns, especially if multiple sectors are doing well simultaneously. That said, it’s important to know that not all markets move in the same direction at all times, so be aware of the details of your investment and not just the overall picture—and balance your stock list accordingly Read More Business Realated News By Clicking Below!! Indexed Universal Life Insurance: What Are They And How Do They Work? What Is Shareholders Equity And How Does It Operate Within A Business? What Is A 504 Loan? Features Of 504 Loan
Jan 08, 2024

What Is An Angel Investor, And How Does Angel Investing Work?
What is an Angel Investor? An Angel investor is referred to as an individual with high net worth. These individuals provide financial backing to small startups and entrepreneurs. In return for their financial investment, they take ownership equity of the company. Although angel investing is risky, it offers potential high returns, as well as a satisfaction to the investor to make a startup strong enough to compete in the market. Unlike venture capital firms that use their investment fund, angel investors use their own net worth to invest in startups and entrepreneurs. This increases their risk appetite a lot. In this article, you will learn some of the essential details of an angel investor and how the process of angel investing works. Then, we will share with you the best tips and ways through which you can become an angel investor. What Is An Angel Investor? When a new startup or business is in need of money, they turn to investors. An angel investor is one such entity or individual who offers the initial fund to a small business or startup and takes ownership equity in exchange. According to Indeed.com, “Angel investors are individuals who fund early-stage businesses in exchange for equity in a company. Beyond traditional bonds and stocks, angel investments provide new ways to diversify investment portfolios. Learning about angel investment can help you understand how angel investment works and what are their pros and cons.” In most cases, an angel investor is an individual or an entity that is fully involved in funding startups and projects for fully professional purposes. In other cases, angel investors can also be wealthy family member/ friend/relative who is offering funds for a startup. The investor can make a one-time investment or an ongoing investment of cash in the business. However, you must not consider angel investors as loan providers. They are just cashing in on an idea that they like to grow in a given industry. They are only expecting rewards in a situation where the business really takes off. Read More: Private Equity Vs. Venture Capital: Key Differences Angel Investing - How Does It Work? As per the views in an article on Investopedia, “Most angel investors are relatively wealthy individuals who are looking for a higher rate of return than can be found in more traditional investment opportunities. They search for startups with intriguing ideas and invest their own money to help develop them further.” As already mentioned before, angel investors only invest in those ventures where they see growth opportunities. However, these ventures are by themselves very risky. As per various reports, it has been found that the success of such small ventures is only 11%. Hence, the investments of angel investors in those ventures are quite modest (an average of around $42,000). Hence, most angel investors do not spend more than 10% of their investment portfolio money on such risky ventures. However, this factor cannot remove the importance of angel investors for businesses that have ideas and are in need of funding. An entrepreneur or a small business is always in search of angel investors who can offer some conventional financing to their businesses. Angel investors, while funding, seek an equity stake or a seat on the board of directors of the business. These investors do not expect to get their money back if the idea does not succeed. Hence, in some cases, angel investments are more favorable for entrepreneurs. How To Become An Angel Investor? - Steps To Follow According to Investopedia, “Angel investors have a genuine interest in innovation and a desire to be involved. Many have been entrepreneurs in the past. Anyone who has the money and the desire to provide funding for startups can be an angel investor. They are welcomed by cash-hungry entrepreneurs who can't get conventional bank loans or don't want the burden of big debt until their ideas take off.” The following are some of the steps that you will need to follow if you want to become an angel investor: 1. Get Your Qualifications To become an angel investor, you will need to meet the standards of an accredited investor. You must have earned at least $200,000 in the past two years (or $300,000 along with a spouse). Otherwise, your net worth must be more than $1 million in investable assets. This restriction is present due to the high risks associated with angel investments. Since accredited investors are financially better equipped to handle a loss if there is such a situation. However, there are still non-accredited investors available, which startups can approach. 2. Start Creating An Investment Portfolio It is important for an angel investor to build an investment portfolio and gain varied experience in investing. With experience in a variety of areas, you will be able to learn how investments in assets work in the country. You can also work for a professional angel investor to see what they do while funding a startup or a small business. 3. Start Sourcing Deals In their industry of expertise, angel investors have an established network of startup founders, entrepreneurs, and small-business owners. As an investor, you will need to maintain rapport with those connections on a regular basis. Hence, you will often hear about new startups where you can source deals effectively. You can also collaborate with other angel investors or a group of investors to fund a particular business after you have formed an angel syndicate. Read More: What Is Indemnity Insurance? And Its Different Types – Let’s Discover Wrapping Up What is an Angel Investor? - You can see from this article that angel investors offer the primary funding source for entrepreneurs and small businesses. However, these investors need to be content with the idea and prospects of the business and must be optimistic and hopeful for its growth. In return for the funding, these investors take ownership equity of the company. However, this is a risky job, and angel investors do not risk more than 10% of their portfolio into investing in these businesses. What do you think is the importance of angel investors for small businesses and startups? Share your views in the comments section below. Read Also: Entrepreneurship – Definition, Meaning, Scope, And More Risk In Entrepreneurship : What Risks Do An Entrepreneur Face? What Are The Different Types Of Entrepreneurship? – Take A Look
Aug 31, 2023

Coyyn – Revolutionizing Modern Trading for All!
Is it just me or has the world of cryptocurrency become even more dynamic as time passes? Digital platforms are catching up fast to the changing trends in crypto trading, and that's where a different league of platforms emerges. Coyyn is one such platform that makes a difference in the trading world. The platform is great for people looking to improve their investment and money management. It offers various tools that help users make better investment decisions, get into trading, or even enhance their investments. The following article will examine the different aspects of crypto trading platforms such as Coyyn and their impact on crypto investment. Understanding Cryptocurrency and the Rise of Coyyn Cryptocurrency has revolutionized the way we think about investment and returns from investment. As cryptocurrency relies on decentralized networks and primarily blockchain technology, it improves transparency and security for the user. The surge in popularity is mainly due to several factors, such as capitalizing on market volatility, which offers the allure of quick profits. Cryptocurrency platforms only require a stable internet connection and some knowledge of the crypto you want to invest in. That's all that you need to trade digital currencies. Even if you are a beginner, you must be interested in crypto trading. Platforms such as Coyyn.com bring you many tools to start your investment journey. The innovative platform Coyyn uses blockchain technology to operate without intermediaries such as financial institutions. This implies that the platform runs without regulations or interference from central organizations. Centralization leads to inefficiency, high transaction costs, and a lack of transparency between the institution and the users. That's how cryptocurrency stocks improve their online presence. Coyyn and similar platforms offer users like you and me the resources to start and even improve our investment portfolios. The primary reason I opt for such digital platforms is their innovative use of technology to inform investment decisions. Another reason is that I like how accessible the information and tools are—someone using digital trading platforms for the first time will have no issue! What Sets Coyyn Apart? One of the primary reasons Coyyn is rising in this sector is its intuitive user interface. It is also one of those platforms that offers seamless trading and navigation through tools. The platform offers advanced trading tools that make trading easy for seasoned investors and a breeze for beginners. These tools range from educating users on different stocks and their market movements to providing expert insights on different digital asset classes. With the help of this platform, I have been able to obtain great insights on crypto, as this intrigued me! The platform keeps the rapid change in technology at the forefront and recommends it based on current market trends. At their core, anything in digital form with substantial value can be owned—this is what every digital asset stands for. A wide range of digital items can be traded; however, people mostly focus on cryptocurrencies. Did you know you can even invest and trade digital artwork? Let us know in the comments if you'd like to learn more! How To Get Started To get started with the platform, you can take the help of the following guide: Visit the website and explore the offerings. You will find the different categories and resources to help you get started. Create an account by signing up on the platform. Simply put in your details and establish your account. Explore the features to familiarize yourself with the platform's features. This will be available through guides and tutorials on the platform. For example, coynn.com crypto has several helpful guides! Use the tools present on the platform to help manage your operations, process payments, and engage with customers. In case of any hindrance, reach out to customer support for assistance during the process. These are some of the best ways you can use the platform to conduct your daily business effectively. You can also make your personal investments easily through the platform. Features of Coyyn We've established that Coyyn is an innovative platform that empowers businesses and individuals in the digital economy. It does so with the use of the following features: User-friendly interface: Coyyn has an intuitive and user-friendly platform that allows even non-technical users to navigate it easily. Secure payment: The site prioritizes security and privacy through encryption in its transaction. The platform uses blockchain-based security measures that protect the digital payments. Thereby securing the user from unauthorized access and fraud. Regulatory compliance tools: The platform features regulatory compliance tools that help businesses navigate regulatory landscapes effectively. Therefore, minimizes risks and builds trust. Low transaction fees: The minimal platform fees for Coyyn is an attractive feature that brings many cost-conscious users. Real-time transaction: Fast transfers make borderless and seamless transactions possible on the platform. It also improves global connectivity. These were all the benefits that help you enjoy crypto transactions to the fullest! The platform also helps you access different educational resources such as the best coynn.com stocks. Let's have a look at the different benefits of the platform. Benefits of Coyyn You need to learn more about how the platform can benefit you long term. Here's how the platform benefits you: 1. Enhanced Productivity Automating routine tasks such as getting updates and operations is met through a centralized platform. Coyyn enhances productivity and redirects the user's focus on high-value activities that help them handle time-consuming processes. 2. Cost Saving The low transaction fees on Coyyn help businesses and individuals find a cost-efficient way to conduct their transactions. 3. Improved Customer Engagement The platform is great for people who struggle with basic technology by providing a user-friendly platform with secure payment solutions. This helps improve customer engagement. 4. Scalability The robust infrastructure helps support business growth while also allowing seamless scaling of operations. 5. Better Decision-making The use of advanced analytics and customizable reporting allows Coyyn to provide insights that aid in informed decision-making. Future of Crypto Trading The future of crypto trading looks bright, what with platforms such as Coyyn. Here's what we can expect soon: Institutional Adoption of crypto is on the rise due to the high demand. There is a high chance that an increasing number of financial institutions will enter the digital assets space. Regulatory Development around cryptocurrency is expected to be clear, which will protect investors while fostering innovation. Technological Advancements that can help address issues such as security and scalability. This will enhance reliability and efficiency of crypto transactions. Analysts estimate that the global cryptocurrency market will triple in the coming decade. As crypto trading ecosystem grows, there is a high chance that there will be a rise in platform such as Coyyn. This is because they can provide efficient, secure and user-friendly solutions that empower users to navigate and capitalize on several opportunities. Sign Up Today! That was all about using Coyyn and starting or improving your trading – be it crypto or stocks and real estate, you can rely on the platform. The platform boasts a plethora of resources for every user, from guides to informational articles. You can also use their tools to manage your portfolio. Let us know in the comments below if you need a guide to navigate such platforms! #Disclaimer: The information provided on this blog is for educational and informational purposes only and should not be construed as financial advice. I am not a licensed financial advisor. Any investment decision you make is at your own risk, and you should consult with a qualified financial advisor before making any investment decisions. This site may contain affiliate links, and I may earn a commission at no additional cost to you. Read Also: Cumrocket Crypto Price: Where To Buy Cummies (Cumrocket) Cryptocurrency? Coinbase: Essential Things To Know About This Fintech Company 5starsstocks.com Making Stock Screening Easier For All!
Feb 07, 2025