





What is Pattern Day Trading? – Fundamentals of Pattern Day Trading

What’s pattern day trading? Pattern day trading is a FINRA-authorized trading scheme. A person who follows this scheme while trading is a pattern day trader. But you must know what is pattern day trading in real?
Now, what is a pattern day trader? A pattern day trader performs at least four day trades within five official days from the margin account.
The valuation of the day trades should be higher than 6% of the overall trade activity in those five days.
There are, however, some critical pattern day trading rules. Follow those rules to ensure your designation as a PDT is not canceled.
Firstly, a pattern day trader must maintain a $25000 balance in margin accounts.
Every pattern day trader has their respective day trading buying power. They can trade amounts that do not cross their buying power limit.
In this article, we will learn more about the pattern of day trade rules and restrictions. We will explore what does pattern day trading means, in detail, also.
What Constitutes a Day Trade?
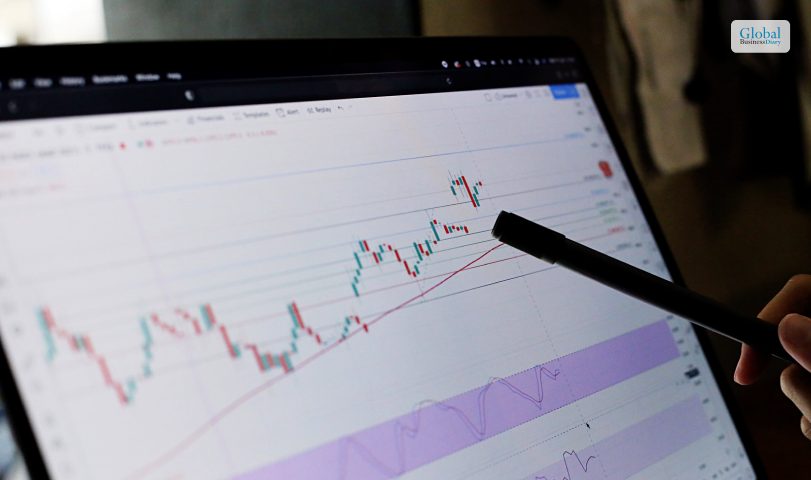
A day trade is the fundamental behind pattern day trading. So, it’s essential you know what constitutes a day trade.
Buying And Selling the Same Stock or ETP Within a Single Trading Day
Did you know you can buy and sell the same stock on the same day? Yes, there are no regulations against it. Experts say opening and closing hours are ideal for buying and selling stock.
Since we trade ETFs through the same stock market windows, the same rule also applies here.
Opening And Closing the Same Options Contracts Within a Single Trading Day
That’s what day traders do. Opening and closing the same options gives them incremental benefits. This method lets you gain from the slightest of price movements.
But I recommend you know the dos and don’ts of this method. Otherwise, you can’t profit as a day trader.
First, you must develop a concrete knowledge of options trading. Secondly, you should interact with other traders to learn about the risks and challenges of trading daily.
Finally, you should be able to make the trade quickly. However, the most important part is managing the risk involved. Experts say that this kind of trading is very volatile and highly unpredictable.
Pattern Day Trading Restrictions

There are not many pattern-day trader restrictions. But you must always be alert to those restrictions. The ground rule is to have at least $25000 in your margin account. So, your minimum portfolio value should be the same. If your balance becomes lower, your trading will cease.
You need to gain more knowledge of what pattern day trading is. It would help if you also learned how to use these restrictions to your strength. Secondly, you only trade through your margin accounts as a PDT.
Applicable To Margin Accounts and IRA Limited Margin Accounts
The margin account used for trading will be flagged if FINRA sees four or more day-trading events within five days. Secondly, the net value of the four or more trades must be more than 6% of the net value traded within the 5-day bracket.
Exemption For Cash Accounts
If you are trading from a cash account, you’re lucky. If you search for what is pattern day trading, you might have yet to come across this cash loophole. But I will tell you.
There are no restrictions on at least 4 or whatever trades here. A cash account user does not need to trade at specific times to be a pattern day trader.
Wait, there’s a catch. You can only use the settled funds in your cash account for trading.
Consequences of Violating Pattern Day Trading Rules

There are dire consequences of violating the rules that I explained above. You’d better learn about those consequences.
Flagging As a Pattern Day Trader
There are no immediate repercussions if you are flagged as a PDT. FINRA knows what is pattern day trading and what is general trading from the trading times and counts within those five days.
However, you cannot open any new position if FINRA recognizes you as a PDT. At the same time, you must deposit more funds into your margin account. You must match the threshold value of $25000.
Experts say that it becomes difficult to change position if you are flagged. So, invest typically until you gain enormous experience in trading.
I recommend you start as a pattern trader when you are sure that you understand day trading in and out. Start by searching what is pattern day trading.
Minimum Equity Call and Deposit Requirements
The pattern day trader rules are straightforward. However, they enjoy less flexibility in the market. For example, I must maintain $25000 as a minimum equity.
You can deposit cash or any eligible security to ensure that you have the minimum equity value in your margin account.
How to Avoid Breaking Pattern Day Trading Rules?

The basic rules I discussed above apply to PDT only. However, you might get a “day trade margin call” if you bypass any of these quintessential rules.
So, I recommend the best way to avoid breaking the pattern trader rule is to trade through a cash account. I also advise you to trade from more than one brokerage account. It can also save you from the PDT rule. Here, I have also discussed other rules.
Monitoring Day Trade Counter
What is a pattern day trader counter monitoring?
You might raise this question now. It’s a healthy habit to ensure you are not breaking PDT rules.
PDTs must monitor all training activities every day, if possible.
In the US, there are many brokerage platforms. These platforms offer various tools or analytics to track the day-trading orders.
Options for Maintaining Portfolio Value Above $25,000
I recommend you deposit cash to make up for the minimum value of $25000. Or else, you can also invest in securities (permissible) to match the value. Above all, you should have a portfolio with a threshold value of $25000. That’s the first criterion you know of while searching for pattern day trading.
One-time Courtesy Flag Removal or Switching to a Cash Account
According to the new changes in the FINRA rules, you can request only one flag removal. You must contact your brokerage firm. They will raise a request for flag removal.
Regulatory Guidance and Brokerage Policies

Your brokerage firm will provide considerable regulatory guidance before you start trading as a PDT.
FINRA Rules On Pattern Day Trading
The brokerage firm’s responsibility is to help you count the number of day trades. You must conduct at least four day-trades in 5 days.
The second rule is the 6% valuation rule. You must ensure that the value of day trades is more than 6% of the total traded value. But this percentage is for your margin account only.
Brokerage-Specific Consequences and Alternatives for Violators
If your brokerage has a relatively forgiving policy, then the consequences of one-time rule violation won’t affect you much.
Maybe you did four trades without intention in a rolling period of 5 days. But you don’t want to be a regular day trader. Even then, you might have to maintain the minimum value of $25000, if the brokerage demands.
Importance Of Communication with Broker for Resolution
When there is any chance of a trading ban against you, the best thing is to contact the broker. The person might suggest any alternative transactions to save you from the consequences.
Educational Resources and Further Learning

How can you become an expert day trader? You certainly know the pattern day trading meaning. Now, you must be more adept.
Access To Educational Resources on Day Trading
I recommend you do ground research on day trading from finra.org or investor.gov by searching what is pattern day trading. You will get all the fundamental knowledge needed to successfully start PDT here. However, many of you are searching for how to be a specialist in it. For them, I recommend joining any credible PDT trading in the US.
With better knowledge and skills, you can ensure a financial gain every time with PDT. You can also safeguard yourself from violating any regulations.
Conclusion
You know what is pattern day trading? It has two basic rules only. Firstly, keep a minimum equity of $25000 through your margin account. Secondly, do day-trading four times in 5 days. That’s enough. You can read the whole article to know more about the policies and restrictions applicable to day-trading.
But I will recommend that you avoid getting flagged as a PDT (in the sense of a defaulter). Be aware of your finances. If you cannot ensure profit from all four transactions, don’t indulge in pattern day trading. A basic knowledge of what is pattern day trading is not enough. Be a day trader at first. If day trading is compatible for you, then indulge further.
For More Business Related Articles Click Below!!

Recent
Dinmukhamet Idrisov and a Gold-Mine Dispute From Kazakhstan’s Oligarchic Past
Oct 16, 2026

Memory Chips Are Becoming More Important in the AI Era
Aug 06, 2026

Why Enterprise Web Applications Still Choose Angular for Long-Term Growth
Aug 04, 2026

Due Diligence Decoded: Why Careful Evaluation Still Wins in Business
Jul 11, 2026

Related Articles

Disruptive Growth of Tech Stocks: Best Tech Stocks 2024
Tech stocks took the stock market by storm in 2024. Searching for the best tech stocks in 2024 will find shocking returns from promising stocks like Microsoft, Apple, Nvidia, and others. Experts found that the total return of S7P 500s in the last year has already surpassed. The SPDR ETF is giving better returns now. In the last ten years, the tech sector went low for short periods. Those windows are ideal for buying tech stocks. If you are new to stock trading, this trend is here to stay. In the upcoming terms, both inflation and an increase in interest rates will be observed. Therefore, you must learn precisely about the best tech stocks in 2024. Nature of Growth of Best Tech Stocks 2024 The first quarter of 2024-25 lies ahead. You must continue reading to learn about some changes in the US stock market. Continuing the same trend, AI and tech companies have posted repetitive gains. However, you must be aware of some other trends. The investors will likely not be happy to see the amount of money going into stocks in the USA. Some factors are responsible for the moderate flow of money in the stock market. Firstly, the inflation is still higher than the level projected by the Federal Reserve. As a result, both S&P and NASDAQ have reduced their gain levels. According to Yahoo Finance, the WSJ also suggests a wait-and-watch policy for budding investors. The Best Tech Stocks 2024 as Growth Stocks Growth stocks are classic favorites of most investors. In simple terms, these stocks give premium returns for each share. The price-to-earnings ratio decides if the return from growth sticks is higher than the industry average. So, you will eagerly want to invest in growth stocks. The best growth stocks now are the best tech stocks in 2024. Some tech stocks gave their highest return ever. Two of them are "Advanced Micro Devices," a semiconductor manufacturer, and Tesla Inc. AMD also saw a whopping growth in shares by 445% in the last five years. Why Best Tech Stocks 2024 Had a Disruptive Growth? Most successful tech companies have excelled in their respective areas. They have taken over global businesses. Also, a strong international supplier or distributor network has been formed. AMD AMD focused on x86 microprocessors only. The company knew there would be low to no competition in this market. Their closest competitor was Intel. However, AMD did upscale production volume. The company tried to take on the global market. Analysis shows that these companies in the tech sector have found their competencies and unique growth areas. Consequently, they will stay in business for a long time and remain profitable, too. In the case of AMD, their success and sustainable strategies allowed them to capture market share. Tesla Tesla's path to glory is almost similar. The basic mantra was to do something in the best possible way. Tesla has become a market leader in manufacturing electric vehicles on a large scale. Like none other, Tesla spontaneously offered sales of its EVs worldwide. As a result, the share price percentage gained by Elon Musk's company is now 823%. However, there is a catch! Aristotle Atlantic Partners, LLC reported that some negative factors will constantly be bugging the growth of companies like Tesla. For example, the Q3 returns of Tesla in 2023 were shallow. The reason was the high-interest rates of financing companies. Performance of Best Tech Stocks 2024 in Different Markets There are multiple indices in the USA. You can follow any of these. Everywhere, the best tech companies are the biggest grossers. The Dow Verizon marked a 2.9% rise in the market, despite a poor revenue return in a short time. As a result, you should treat these companies as growth stocks. There is a high chance that the cumulative return over 3 to 5 years will be satisfactory. However, you must note that the cumulative performance of tech companies in the short term is also excellent. Big tech giants like Microsoft gave 1.5% growth. At the same time, Amazon gave 1.3% returns. S&P 500 GE Aerospace is the biggest grosser over the S&P 500 among the best tech stocks in 2024. It showed a growth of 8.3%. GE Vernova also gave similar results (8.2%). Other than the best tech stocks in 2024, General Motors and PHM achieved good growth. But, if you mark the number of tech companies that marked the chart, you will know their potential. In the S&P 500, Nvidia showed the second most prolific growth among the best tech stocks in 2024, after GE Aerospace. In April 2024, it marked a growth of 3.7%. Other brands like UPS also fared better, marking 2.4% growth, despite earning less than the stipulated revenues. NASDAQ 100 The trend is also the same here. Tesla sits at the top of the chart with 1.8% higher revenue than Q1. Although it means that revenues have slumped since last quarter, Tesla's value continues to increase. However, NASDAQ added a unique name- Cadence Design Systems. The company was stable for a long time. However, it slipped 1.1% in the current quarter. Categorizing Best Tech stocks 2024 There are different categorical parameters to detect the best tech stocks in 2024. Some of those are value-oriented. While others exhibited fast growth, only some have shown the best momentum. Best Tech Stocks 2024, Based on Value If you are new to stock trading, you must know what value investing is. It is the investment strategy of detecting stocks that are not performing outside their actual values. You can use the P/E ratio to identify the undervalued stocks. After some adjustments in the market, these stocks would reflect their actual values. It would be much higher than the current valuation. According to Investopedia, the best value stocks of 2024 are Yiren Digital Ltd and Surge Pays Inc. The former's trailing P/E ratio for the last 12 months is 1.4. At the same time, the latter is 2.7. Yiren reflects strong fiscal growth in 2023. It also shows a YoY revenue growth of 43%. Surge Pays is also a tech company. In 2023, the revenue reported by the company was $137.1 million. In other terms, the revenue increased by 13% since 2022. Best Tech Stocks 2024, Based on Growth Rate Here, the trajectory captures the stocks with the fastest growth rate. The stated growth rate is measured by the increase in revenues and the company's per-share earnings. You can check the revenue to detect whether it's a fast-growing stock. You can also check the "earnings per share" data. Investopedia says the fastest-growing stocks are the best tech stocks in 2024. In this connection, Spotify had a revenue growth of 22%. There are a few factors responsible for its steady growth. As a stock trader, you must identify these factors, too. The company's premium subscribers grew by 15%. However, Investopedia finds that Applied Digital Corp is the fastest-growing tech stock by a significant difference. The company manages data centers across the USA. APLD recorded approximately 242% growth in revenue. Best Tech Stocks 2024, Based on Momentum Momentum refers to a specific strategy of investing, too. Here, the traders consider the already existing market trends. It is as simple as finding the stocks that outpaced others in the same industry regarding returns. Experts say that the stocks that have been growing for some time will continue doing so until there is some external market change. For the Best tech stocks in 2024, you can identify the momentum from several factors. These are the launch of new products or the gain of popularity. Cleanspark Inc., Virtra Inc., and Samsara Inc. are the tech stocks showing the highest momentum. Cleanspark is a Bitcoin mining company. The share price of the company is $21.2. Also, the 12-month total return of the brand is 713%. VirTra has developed video simulation technology for military and legal applications in the USA. In recent years, the simulators of VirTra have spread to 40 countries. As a result, the company gained a process profit of $24 million. Final Thoughts....... Best tech stocks 2024 have outperformed players from other industries. At the same time, they will mark sustainable growth soon, too. The world is digitizing at a pace. Hence, tech companies will have undaunted growth opportunities. However, it would help if you had your priorities sorted. Companies that scaled in less time are momentum stocks. Invest in them on a short-term basis and reap the benefits. However, if you are searching for a long-term investment, go for Microsoft or Nvidia. The current market condition is favorable for the tech companies. However, the interest rate policies in the surrounding market will also impact their performance. #Disclaimer: The information provided on this blog is for educational and informational purposes only and should not be construed as financial advice. I am not a licensed financial advisor. Any investment decision you make is at your own risk, and you should consult with a qualified financial advisor before making any investment decisions. This site may contain affiliate links, and I may earn a commission at no additional cost to you. For More Business Related Information Click Below!! Why Businesses For Sale Make Great Investments? How To Maximize Your Settlement In A Wrongful Death Lawsuit? Risk Management Careers: A Comprehensive Guide to Top Risk Management Jobs
May 09, 2024

How Investment Strategies Can Expand Your Real Estate Portfolio
Not only does investing in real estate involve the purchase and sale of properties, but it also requires the construction of a diversified portfolio that can produce passive income and long-term wealth. Real estate professionals who seek to broaden their portfolios with investment properties often find an invaluable resource in a guidance coach specialized in this sector. This article explores multiple investment strategies taught within these coaching programs; providing agents with strategic direction for expanding their portfolios and attaining financial success. Understanding Real Estate Investment Strategies Based on factors such as market conditions, investment goals, risk tolerance, and available capital: real estate investment strategies exhibit significant variation. Real estate coaching programs--by providing comprehensive guidance on diverse investment approaches--empower agents to navigate the complexities of the investment landscape with informed decisions. 1. Rental Properties Real estate coaching commonly teaches the strategy of investing in rental properties; such investments promise a steady cash flow through monthly rent--an attractive, reliable source of passive income. With this in mind: real estate coaches educate their agents on critical considerations including property selection; tenant screening – an essential facet to defend against potential risks associated with problematic tenants–property management—closely tied to maintaining optimal conditions within the rented space—and effective rental pricing strategies: all tools used not only to maximize returns but also mitigate possible hazards. 2. Fix and Flip Purchasing distressed properties, renovating or remodeling them, and then selling for a profit: that is the essence of fix and flip strategies. Real estate coaching programs provide invaluable guidance on this process; they help identify undervalued properties—estimate renovation costs precisely—and manage renovation projects effectively. Moreover–to ensure a successful sale–these programs equip agents with skills to execute analytic market trends, assess property values critically–and ultimately conduct lucrative fix-and-flip transactions. 3. Wholesaling Real estate coaches impart to agents the skills of identifying motivated sellers, negotiating advantageous purchase contracts and cultivating relationships with investor networks - all crucial elements in the strategy of wholesaling: an investment approach involving contracting properties at prices below market value; subsequently, these contracts are assigned to other investors for a fee. It is evident then that strong negotiation abilities and a comprehensive understanding of market dynamics—both emphasized within real-estate coaching programs—are vital prerequisites for successful wholesaling ventures. 4. Commercial Real Estate Commercial real estate investment provides opportunities for superior returns and diversification compared to residential properties. Coaching programs in real estate encompass an array of commercial investing aspects: property types; leasing agreements - tenant relations; financing options – and market analysis. Through these courses, agents acquire the knowledge necessary to evaluate commercial properties, gauge income potential, and master the intricacies inherent in commercial transactions. 5. Real Estate Syndication Real estate syndication: this process entails the pooling of funds from numerous investors; its aim is to acquire larger properties or portfolios. Coaching programs in real estate serve a crucial role—they educate agents on the nuances of syndication structures, legal aspects, investor relations, and strategies for fundraising. By delving deep into syndication models, partnership agreements, and regulatory compliance requirements--they equip agents with the knowledge necessary for effective participation in syndicated real estate investments. Implementing Investment Strategies with Guidance Real estate investment strategies present opportunities for lucrative wealth creation; however, they carry inherent risks and complexities. To effectively implement these strategies and navigate potential challenges, agents rely on real estate coaching programs that equip them with the necessary knowledge, tools–as well as supportive guidance. A. Market Research and Analysis Real estate coaches underscore: that conducting thorough market research, and analysis--identifying investment opportunities, and assessing market trends is crucial. Agents master the evaluation of supply and demand dynamics; they scrutinize economic indicators–they pinpoint emerging investment markets brimming with growth potential. B. Financial Planning and Risk Management Careful financial planning and risk management are essential for effective real estate investing. Real estate coaching programs assist agents in formulating investment plans that align with their financial goals, risk tolerance, and investment timelines. These agents acquire the knowledge to evaluate investment risks, and diversify their portfolios; furthermore, they develop and implement strategies to mitigate risks effectively–thus safeguarding their investments. C. Networking and Relationship Building Successful real estate investing necessitates essential components: networking and relationship building. Real estate coaches not only advocate for the establishment of robust networks within the industry but also encourage agents to forge relationships with professionals in this field; furthermore, they promote resource utilization--leveraging opportunities for collaboration is paramount. Lenders, investors, and contractors - among other key stakeholders - become targets of agent cultivation as part of learning how best to support their investment endeavors. D. Continued Education and Adaptation The dynamic field of real estate investing necessitates continuous education and adaptation for long-term success. Emphasizing the importance of remaining informed about market trends, regulatory changes, and industry innovations: these are key elements in real estate coaching programs. We actively encourage agents to pursue learning opportunities; and concurrently stay abreast with industry developments – this way they can adapt their investment strategies accordingly--capitalizing on emerging opportunities while mitigating potential risks. E. Real Estate Crowdfunding Real estate crowdfunding has emerged as a popular investment option, allowing investors to pool their funds to invest in a variety of real estate projects. Real estate investment coaching programs educate agents on the fundamentals of crowdfunding platforms, investment structures, and regulatory requirements. Agents learn how to evaluate crowdfunding opportunities, assess project feasibility, and navigate the legal and compliance aspects of crowdfunding investments. Real estate crowdfunding provides access to a diverse range of investment opportunities, including residential, commercial, and multifamily properties, without the need for substantial capital outlay. By understanding the intricacies of real estate crowdfunding, agents can diversify their investment portfolios and participate in projects that align with their investment objectives and risk tolerance. Conclusion Real estate professionals, equipped by pivotal real estate coaching programs with the necessary knowledge and confidence, navigate the complexities of investing in constructing successful investment portfolios. Through diligent implementation of strategies taught in these coaching sessions - often leveraging opportunities previously unseen - they unlock new avenues for growth and prosperity in this dynamic field: thus expanding their clients' wealth through strategic investments; a rewarding journey that not only promises financial independence but also offers potential accumulation of substantial riches. Read Also: Falguni Nayar Becomes India’s Wealthiest Self-Made Female Billionaire Why Business Continuity Planning Is Essential For Your Company? The Importance Of Research In Making Investment Decisions
Feb 05, 2024

Technical Analysis Vs Fundamental Analysis: What’s The Best Way to Analyze Stocks?
Your broker sorted some stocks for you. However, before investing, you may consider why these stocks are better than others. The debate of technical analysis vs fundamental analysis is nothing new. But I feel that both are equally important. If you were thinking something like this and landed here, it's excellent news. I will discuss and debate the two common ways brokers sort or pick stocks. Each method deploys a different perspective to analyze stocks. Fundamental analysis discovers stocks with immense growth potential. Therefore, the fundamental analysis of stocks will return reasonable prices. Technical analysis helps you to decide if it's the right time to buy or sell a stock. It also calculates the statistical patterns visible on the stock charts. The Main Tools of Technical Analysis You must know some specialized tools and methods to do technical analysis. I have discussed these tools in detail. Technical Analysis Indicators The leading indicators in technical analysis are the price and volume of the stock. Therefore, you must do the mean reversion of these two parameters. As a result, it shows if a stock is investable. You can access all these values from the stock charts. You can also pick any reliable chart with complete information. Volume Analysis The number of company shares traded over time tells you the strength of its volume. But to do a volume analysis, keep a few things in mind. Here, you study the number of shares traded over a specific time. If the number is more, the stock is reliable. Relative Strength All stocks have some projected trading value. If the stock is not trading at that value, you say it's undervalued. However, if your stock trades at a higher value, it is called over-valued. Chart Pattern Analysis I have already mentioned that the primary goal of technical analysis is to check the chart pattern. This clears up the debate about fundamental analysis vs technical analysis. You don't go straight up for chart pattern analysis in fundamental analysis. The stock price movements in a specific market show how the stock is performing. Therefore, you can guess how the stock will perform in the future. Candlestick Pattern Analysis You need to know the candlestick pattern for analyzing a stock properly. Here, you also analyze the patterns of price movement. In this analysis, there are three things to consider. These are: The entire body of the stock starts from the opening to the closing range. The shadow of the candle, which shows the daily highs and lows of the stock. A movement within the range in green color implies price growth of the stock. A movement within the range in red color shows that the stock price is decreasing. Support And Resistance These are two critical parameters for analyzing the stock value from the chart trends. In a chart, there are some horizontal lines. These lines indicate the regions beyond which the stock price does not certainly move. So, we see that technical analysis is based on trend data. If you compare the benefits of technical analysis vs fundamental analysis, here's a brownie point for technical analysis. Trend Analysis Many of us are caught between technical vs fundamental analysis. However, they should know that technical analysis is only for short-term trend analysis. Trend analysis is elementary and effective. You must review the stock chart to interpret the past and present movements. After that, you can predict future trends and prices. You can select any of the parameters I discussed above to trace movement. However, experts suggest that you mostly use historical prices and volume. The Pros and Cons of Fundamental and Technical Analyses Technical trading vs fundamental trading is a never-ending debate. But both have some benefits and limitations. You should get to know both better. Pros Of Technical Analysis Vs Fundamental Analysis In the following table, you will find an elaborate analysis of the pros of fundamental and technical analysis. Benefits of Fundamental AnalysisBenefits of Technical AnalysisYou can make timely decisions with technical analysis. For example, you can make real-time decisions to buy or sell a stock with technical analysis. You do not need to invest in a range of data from different sources, like fundamental analysis One of the main benefits of fundamental analysis is risk mitigation. When you have analyzed the intrinsic values of the company, you know if the stock will give returns in the future or not. You do not have the risk of a downfall even if it is performing good. You know a dip will be followed by a certain rise in value. It is better for sustainable investments as it analyzes the intrinsic strengths of the company The simplicity of technical analysis is an added advantage. So, you only must interpret easy graphical representations during technical analysis. Fundamental analysis is highly adaptable. You can do fundamental analysis of stocks, assets, bonds, and currencies Technical analysis is better for risk management. So, you can use the tools like stop loss orders anytime. These technical analysis tools are easy to use. You can repetitively use these tools to check the real-time risks of trading in a stock. Technical analysis wins here in debate of fundamental analysis vs technical. Fundamental analysis cannot provide psychological insights. At best, it can show the brand awareness level or reputation of a brand among customers. However, technical analysis involves the analysis of the stock charts. The charts show the real time sentiment of traders about a stock. The qualitative factors make fundamental analysis beneficial. Here, you consider the brand value in the market, brand reputation among customers, and the leadership efficiency of the firm. Technical analysis is equally adaptable. You can also do technical analysis of stocks, assets, bonds, and currenciesTechnical analysis is equally adaptable. You can also do technical analysis of stocks, assets, bonds and currencies The table shows that technical and fundamental analysis pros are widely different. So, it means that there should not be a debate about technical analysis vs fundamental analysis. The objective of these two modes of analysis should be different if their benefits are different. Cons Of Technical Analysis Vs Fundamental Analysis I have already discussed that both these methods have some disadvantages too. It's time to see if the cons of technical analysis are greater than fundamental analysis or vice versa. Cons of Fundamental AnalysisCons of Technical AnalysisSome tools may heavily influence traders to make a move. Often, you do not consider the other tools. It is not a good tool for short-term gains. Technical analysis can be subjective, too. However, it is more trend based. As all traders are analyzing the same trends, it's less subjective than fundamental analysis. It can raise false signals. As a result, if you invest high value against a false signal, it results in heavy lossesFundamental analysis is often subjective. The outcome may vary from one trader to another. Technical analysis can be subjective, too. However, it is more trend-based. As all traders are analyzing the same trends, it's less subjective than fundamental analysis. How Can Fundamental and Technical Analyses Be More Robust? Traders are always trying to do more precise fundamental or technical analysis. Let's learn how we can increase the robustness of these methods. Ensuring Accurate and Updated Data The primary step to better fundamental and technical analysis is to get your facts right. Firstly, ensure the company website has the updated data for the financial years 2022, 2023, and 2024. If not, avoid fundamental analysis based on historical data. While doing technical analysis, check when the stock chart was last updated. If it shows: "updated few days ago", avoid it. Using Machine-learning Algorithms Machine learning is an essential tool for chart data analysis. You can use Q-Learning to get suggestions on trading strategies and advice on buying or selling in real time. Rigorous Backtesting It's a method of using technical analysis tools on historical data. If your methods can detect the actual trends of historical chart data, then they might detect future trends accurately, too. Assessing The Sensitivity of Models to Changes in Assumptions Both fundamental and technical analysis depend on the trader's assumptions. So, try out different assumptions to see the difference in the prediction results for different assumptions. Which Is More Important, Fundamental or Technical Analysis? The debate of technical analysis vs fundamental analysis should not end with selecting one over the other. It is more important to understand when both should be used. The Importance of Each Approach in Investment Decision-Making The context of the application of each method is entirely different. No method is better for decision-making. So don't read this blog with a divide of technical analysis vs fundamental analysis in mind. I would recommend you invest in a stock for a more extended period for the best results. But you must keep checking the trends with technical analysis occasionally, too. Tailoring Analyses to Individual Goals and Risk Tolerance You may want to make quick money. Also, you decide to sell or buy stocks in quick succession. Then, technical analysis is best for you. But you should have a high risk tolerance. Any significant investment against a false alarm can result in substantial losses. The Bottom Line In a nutshell, you need both technical and fundamental analysis at multiple time points. There is no need to debate technical analysis vs fundamental analysis. Both are critical in their own way. The basic divide is fundamental analysis and is suitable for long-term investment. On the other hand, technical investment is for short-term investment. It gives you quick opportunities to invest. Fundamental analysis helps you decide on ambitious stocks that will also give future returns. However, technical analysis will inform you when to buy or sell stock. For More Business-Related Informative Articles, Click Below!! Why Businesses For Sale Make Great Investments? Disruptive Growth of Tech Stocks: Best Tech Stocks 2024 The Role of Franchise Consultants in Expanding Businesses
May 29, 2024

Is PHI Stock A Good Buy? Everything You Should Know
PHI stock prices have shown a positive trend in the past few months. So chances are there that you can earn big if you invest in this stock. Before investing in PHI stock, you need to understand its background and assets to withstand the stock holdings for a longer duration. The Company is one of the oldest conglomerates in the USA and has shown a promising growth rate over the past few years. As a result, investors in the US stock market are now witnessing PHI stock as the safest option for them in 2022. Company Profile & Background Of PHI Group PHI( Provincial Holdings Inc) is one of the oldest companies in the USA. In 1982, it was established with the name of JR consulting. The Nevada Corporation is primarily into mergers and acquisition business offerings. The company's name got changed to Provincial Holding Inc after acquiring California's Investment banking and asset management company in 2000. In 2009, the company's name was again altered as the PHI Group, and now it is operating its functions in the USA smoothly. Reasons To Buy The PHI Stock In 2022 There are several reasons you should buy the PHI stocks in 2022 to get better returns from your investments. Some of them are as follows. But, first, it will hint at why you must buy the PHI Stocks in 2022. 1. Shareholders Have Witnessed Increase In Hedge Funds Shareholders have witnessed increased hedge fund interest over the last few quarters in PHI stock. As a result, it comprises eight hedge fund portfolios over the end of the third quarter in 2022. The all-time high statistics of PHI stocks stand as 7 out of 10 ratings, and it will deliver better returns to its investors. It comprises the bullish hedge fund situation for the stocks that sit for their all-time high. There are currently five hedge funds in all of the database positions for the PHI group. 2. PHI Stock Will Experience The Bull Run Insider Monkey has analyzed PHI stocks, will show a bullish run in the upcoming years. From the previous quarter, the growth rate of the stocks for the PHI group is more than 60%. Therefore, the shareholders can earn more from it if they can invest their money now. Later on, the prices of the stocks may fluctuate. Hedge fund managers are boosting their Holdings and market caps on this stock. It is providing safe heaven to its investors during the upcoming years. 3. Investors Are Confident To Get Better Returns Renaissance Technologies is now holding $91.5million worth of the shares of the PHI company, so the chances of returns will be higher. The chances of earning from PHI stocks are more as bigger organizations are the clients of these companies, which ensures stable growth. Therefore, experts of the stock markets believe PHI will provide a higher stock return in the upcoming years. The chances of price fluctuations and company debt are less. The PHI group believes in a Zero debt policy, and so PHI stock forecast will show better returns for their investors. Also Check: Is MAX Stock A Good Buy? Everthing You Should Know 4. Agricultural Sector In US Is Showing Growth You may wonder why I am talking about the agricultural sector in the context of the PHI group, right. The PHI group invests its money in the Agricultural sector company’s stocks and earns the return. Currently, the stock prices of the agricultural sector are growing by 1.53 percent every year. Due to this factor, the chances of the growth rate of the PHI group will be on the higher side, and you can get better returns from your investments. As a result, the PHI stock prices will increase rapidly and will deliver better returns for their investors. 5. Healthcare Sector Is Showing Steady Growth The US government spends almost 18 percent of the GDP in the health care sector for its development and growth, and the PHI group also invests its money in this area. Investors will get stable returns from their investments in PHI stocks as the management of the PHI group takes care of its investors very aptly. The innovative leadership and out-of-the-box thinking ability of Mr. Fahman, who possesses 30years of experience in the Corporate management field and settling the Corporate management strategy, have never upset its investors. As a result, you can also expect better returns from this company. 6. Real Estate Industries Are Witnessing Healthy Returns The average sale price of the real estate sector has increased in the past few years. Its count stands as 43 percent growth rate over the past few years. The most astonishing fact for the investors of the PHI stockholders is that this company also invests its money in this area as well. The chances of earning more money increase when PHI makes more money from these country's core sectors. Do not waste your time and buy the stocks of PHI group to earn big within the next few years. The Real estate sector will also grow rapidly in the upcoming years, and the investors will witness better returns from their investments. Also Check: What Is SHLL? Is SHLL A Good Stock In 2022? Final Take Away The world market economics is changing rapidly, and countries like the USA are now showing a better growth rate post-COVID-19. As a result, the PHI stock prices will increase in upcoming years. Experts of the stock markets are at least confident about the growth in the share prices of the PHI group. Now, you may have some different opinions about this fact. You can feel free to share your opinions, comments, and advice in our comment box. Your opinion is valuable to us, and so we are expecting a valid reply from your end. Do not forget to share this article with your friends, peers, and colleagues. FAQs ( Frequently Asked Questions) [su_spoiler title="1. How Can You Buy The PHI Stock?" open="yes" style="default" icon="plus" anchor="" anchor_in_url="no" class=""]You can purchase the PHI stock from the online brokerage account. It can help you to earn more money in a shorter period. You can complete the registration process in the online mode as well to buy the PHI stock.[/su_spoiler] [su_spoiler title="2. What Is The Current Growth Trend Of The PHI Group?" open="yes" style="default" icon="plus" anchor="" anchor_in_url="no" class=""]The current growth trend of the PHI group is 86.1% due to the higher returns it seeks from the stock market. You will get better returns from your investments in a short span of time. You have to ideate the facts in the right order to achieve your goals.[/su_spoiler] [su_spoiler title="3. In Which Sectors PHI Makes Investments?" open="yes" style="default" icon="plus" anchor="" anchor_in_url="no" class=""]PHI makes its investments in various sectors some of them are as follows:- Sustainable agriculture. Renewable energy. Healthcare. Real Estate. Multiple Commodities. [/su_spoiler] More Resources: Should You Buy GS2C Stock? Everything You Should Know What Is BA Stockwits? Is BA Stockwits A Good Stock To Buy? Is Twitch Stock Worth Buying Now? Everything You Should Know
Jan 22, 2022