


Technical Analysis Vs Fundamental Analysis: What’s The Best Way to Analyze Stocks?
Your broker sorted some stocks for you. However, before investing, you may consider why these stocks are better than others. The debate of technical analysis vs fundamental analysis is nothing new. But I feel that both are equally important.
If you were thinking something like this and landed here, it’s excellent news.
I will discuss and debate the two common ways brokers sort or pick stocks.
Each method deploys a different perspective to analyze stocks. Fundamental analysis discovers stocks with immense growth potential. Therefore, the fundamental analysis of stocks will return reasonable prices.
Technical analysis helps you to decide if it’s the right time to buy or sell a stock. It also calculates the statistical patterns visible on the stock charts.
The Main Tools of Technical Analysis

You must know some specialized tools and methods to do technical analysis. I have discussed these tools in detail.
Technical Analysis Indicators
The leading indicators in technical analysis are the price and volume of the stock. Therefore, you must do the mean reversion of these two parameters. As a result, it shows if a stock is investable.
You can access all these values from the stock charts. You can also pick any reliable chart with complete information.
Volume Analysis
The number of company shares traded over time tells you the strength of its volume. But to do a volume analysis, keep a few things in mind. Here, you study the number of shares traded over a specific time. If the number is more, the stock is reliable.
Relative Strength
All stocks have some projected trading value. If the stock is not trading at that value, you say it’s undervalued. However, if your stock trades at a higher value, it is called over-valued.
Chart Pattern Analysis
I have already mentioned that the primary goal of technical analysis is to check the chart pattern. This clears up the debate about fundamental analysis vs technical analysis. You don’t go straight up for chart pattern analysis in fundamental analysis.
The stock price movements in a specific market show how the stock is performing. Therefore, you can guess how the stock will perform in the future.
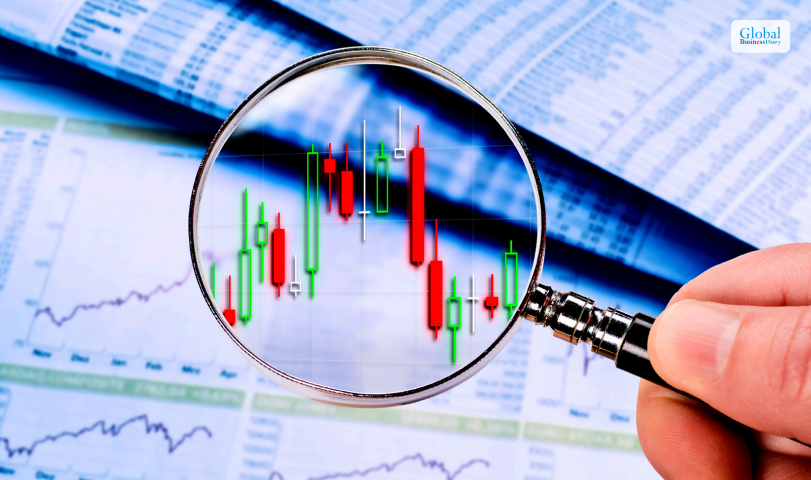
Candlestick Pattern Analysis
You need to know the candlestick pattern for analyzing a stock properly. Here, you also analyze the patterns of price movement.
In this analysis, there are three things to consider. These are:
- The entire body of the stock starts from the opening to the closing range.
- The shadow of the candle, which shows the daily highs and lows of the stock.
- A movement within the range in green color implies price growth of the stock.
- A movement within the range in red color shows that the stock price is decreasing.
Support And Resistance
These are two critical parameters for analyzing the stock value from the chart trends. In a chart, there are some horizontal lines. These lines indicate the regions beyond which the stock price does not certainly move.
So, we see that technical analysis is based on trend data. If you compare the benefits of technical analysis vs fundamental analysis, here’s a brownie point for technical analysis.
Trend Analysis
Many of us are caught between technical vs fundamental analysis. However, they should know that technical analysis is only for short-term trend analysis.
Trend analysis is elementary and effective. You must review the stock chart to interpret the past and present movements. After that, you can predict future trends and prices.
You can select any of the parameters I discussed above to trace movement. However, experts suggest that you mostly use historical prices and volume.
The Pros and Cons of Fundamental and Technical Analyses

Technical trading vs fundamental trading is a never-ending debate. But both have some benefits and limitations. You should get to know both better.
Pros Of Technical Analysis Vs Fundamental Analysis
In the following table, you will find an elaborate analysis of the pros of fundamental and technical analysis.
| Benefits of Fundamental Analysis | Benefits of Technical Analysis |
|---|---|
| You can make timely decisions with technical analysis. For example, you can make real-time decisions to buy or sell a stock with technical analysis. You do not need to invest in a range of data from different sources, like fundamental analysis | One of the main benefits of fundamental analysis is risk mitigation. When you have analyzed the intrinsic values of the company, you know if the stock will give returns in the future or not. You do not have the risk of a downfall even if it is performing good. You know a dip will be followed by a certain rise in value. |
| It is better for sustainable investments as it analyzes the intrinsic strengths of the company | The simplicity of technical analysis is an added advantage. So, you only must interpret easy graphical representations during technical analysis. |
| Fundamental analysis is highly adaptable. You can do fundamental analysis of stocks, assets, bonds, and currencies | Technical analysis is better for risk management. So, you can use the tools like stop loss orders anytime. These technical analysis tools are easy to use. You can repetitively use these tools to check the real-time risks of trading in a stock. |
| Technical analysis wins here in debate of fundamental analysis vs technical. Fundamental analysis cannot provide psychological insights. At best, it can show the brand awareness level or reputation of a brand among customers. However, technical analysis involves the analysis of the stock charts. The charts show the real time sentiment of traders about a stock. | The qualitative factors make fundamental analysis beneficial. Here, you consider the brand value in the market, brand reputation among customers, and the leadership efficiency of the firm. |
| Technical analysis is equally adaptable. You can also do technical analysis of stocks, assets, bonds, and currencies | Technical analysis is equally adaptable. You can also do technical analysis of stocks, assets, bonds and currencies |
The table shows that technical and fundamental analysis pros are widely different. So, it means that there should not be a debate about technical analysis vs fundamental analysis. The objective of these two modes of analysis should be different if their benefits are different.
Cons Of Technical Analysis Vs Fundamental Analysis
I have already discussed that both these methods have some disadvantages too. It’s time to see if the cons of technical analysis are greater than fundamental analysis or vice versa.
| Cons of Fundamental Analysis | Cons of Technical Analysis |
|---|---|
| Some tools may heavily influence traders to make a move. Often, you do not consider the other tools. | It is not a good tool for short-term gains. |
| Technical analysis can be subjective, too. However, it is more trend based. As all traders are analyzing the same trends, it’s less subjective than fundamental analysis. | It can raise false signals. As a result, if you invest high value against a false signal, it results in heavy losses |
| Fundamental analysis is often subjective. The outcome may vary from one trader to another. | Technical analysis can be subjective, too. However, it is more trend-based. As all traders are analyzing the same trends, it’s less subjective than fundamental analysis. |
How Can Fundamental and Technical Analyses Be More Robust?

Traders are always trying to do more precise fundamental or technical analysis. Let’s learn how we can increase the robustness of these methods.
Ensuring Accurate and Updated Data
The primary step to better fundamental and technical analysis is to get your facts right. Firstly, ensure the company website has the updated data for the financial years 2022, 2023, and 2024. If not, avoid fundamental analysis based on historical data.
While doing technical analysis, check when the stock chart was last updated. If it shows: “updated few days ago”, avoid it.
Using Machine-learning Algorithms
Machine learning is an essential tool for chart data analysis. You can use Q-Learning to get suggestions on trading strategies and advice on buying or selling in real time.
Rigorous Backtesting
It’s a method of using technical analysis tools on historical data. If your methods can detect the actual trends of historical chart data, then they might detect future trends accurately, too.
Assessing The Sensitivity of Models to Changes in Assumptions
Both fundamental and technical analysis depend on the trader’s assumptions. So, try out different assumptions to see the difference in the prediction results for different assumptions.
Which Is More Important, Fundamental or Technical Analysis?

The debate of technical analysis vs fundamental analysis should not end with selecting one over the other. It is more important to understand when both should be used.
The Importance of Each Approach in Investment Decision-Making
The context of the application of each method is entirely different. No method is better for decision-making. So don’t read this blog with a divide of technical analysis vs fundamental analysis in mind. I would recommend you invest in a stock for a more extended period for the best results. But you must keep checking the trends with technical analysis occasionally, too.
Tailoring Analyses to Individual Goals and Risk Tolerance
You may want to make quick money. Also, you decide to sell or buy stocks in quick succession. Then, technical analysis is best for you. But you should have a high risk tolerance. Any significant investment against a false alarm can result in substantial losses.
The Bottom Line
In a nutshell, you need both technical and fundamental analysis at multiple time points. There is no need to debate technical analysis vs fundamental analysis. Both are critical in their own way.
The basic divide is fundamental analysis and is suitable for long-term investment. On the other hand, technical investment is for short-term investment. It gives you quick opportunities to invest. Fundamental analysis helps you decide on ambitious stocks that will also give future returns. However, technical analysis will inform you when to buy or sell stock.
For More Business-Related Informative Articles, Click Below!!

Recent
Corporate Software Inspector: The Simple Way to Keep Your Company Safe
Mar 02, 2026

Why Business Intelligence Exercises Are Important for Effective Data Analysis
Feb 22, 2026

The Hidden Cost of Dirty Curtains: More Than Just an Eyesore
Feb 20, 2026

Strategic M&A: Turning Opportunity Into Lasting Value
Jan 24, 2026

Related Articles
Learn How to Read Option Chain: Benefits and Prospects
An options chain is a listing of all the option contracts. Both puts and calls of a particular contract are included. Most of you search for how to read an option chain. Here, I want you to focus on the put and call elements. The call option allows you to buy a particular stock. However, the put option is used when selling a stock. But there are other elements as well. These are the strike price, expiry date, and color coding. There are many benefits of understanding how options chains work. Firstly, it helps you to understand all options for any underlying asset. I feel that you must know how to read option chains to make informed stock trading decisions. You will then find it easier to extract essential insights and track the probable future movements of stocks. Experts also say that knowledge of option chains helps you evaluate the depth and liquidity of any option contract. Finding Options Information It is vital to track information about individual options. For instance, you can see the strike data in the middle. All information related to calls and puts at the same price is mentioned adjacent. Real-time Options Chains on Financial Websites You can access any vital website to gain knowledge of real-time options. These options are also listed in relation to the related stock prices and other details. I will recommend the following sites to learn about real-time option chains: Yahoo Finance Charles Schwab’s website WSJ Other registered or FINRA-recommended sites Links To Options Chains on Stock Price Charts You can easily access and review the option prices from the stock price charts. Moreover, these charts tell you about the current trends of specific options. If you are a trader, then stock charts are an excellent data source for you. You can easily see the highs, lows, and even the "chops" from the chart. If you read all the details on the chart, you can quickly learn how to read the option chain. At least the basics. What An Options Chain Tells You? Options chains give you some stock data. This data is helpful when making trading decisions. Derivation Of Option Value from Underlying Securities As I said, you can do a good trend analysis from the Options chain. If you don't know how to read an option chain, learn that first. After that, you can anticipate the dates when you will get the best value of a stock. Accordingly, you can also fathom the best date to buy and sell the stock. When you can do that, you've learned how to read an option chain. You must agree on a date when you will sell or buy an asset at an agreed price. At the same time, the price of the future contract can be derived from the underlying asset price. Distinction Between Calls and Puts Calls and puts are basically indicators to buy or sell a stock. Definition Of Call Options There are mainly two options. When you read how to read an option chain, you will come across these two. The call option gives you the right to buy the underlying option at a given price on a given date. Definition Of Put Options The opposite of a call is a put option. Put means to ward off or sell an option. But you must again specify the projected price and date of sale. Expiration Dates and Their Impact on Option Value There are expiration dates for any stock. For instance, you buy the call option for any stock that expires in June. This stock has only 30 days to expire, so its value will depreciate immediately. You get such info from the expiration date of the stock. Order Of Columns in An Options Chain The order of columns within the options chain is for your convenience. You need to consult all the parameters in descending order. There are individual symbols for each option. However, the symbol for option contracts of the same stock would be different, with a different expiration date. You should note these differences. It will give you a clear idea of the contract's expiration date. The general order of columns is: Strike price Symbol Last price Change in price Bid price Ask price Volume Open interest Understanding Calls and Puts When you buy any options contract, you get the right to buy or sell it. However, that should only happen at a stipulated date and fixed rate. But you need concrete knowledge of how to read an options chain. Clicking the "buy" option does not fix your date and price. You can negotiate that yourself. You sell it on the due date. Or you may sell it any time before then, too. Americans have traded 39 million option contracts on average in 2021. CNBC shows that the rate increased by 35% on a YoY basis. However, NASDAQ data shows that only 7% of Americans sell the option contract on the last expiry date. You need to click the call or put option to get the option and authorization to buy or sell the stock. Call Options: The call option is there for you to request to buy an option contract. Now you know how to read an options chain. That means you also know you must buy it within the stipulated date and price. However, there are some additional clauses too. But most importantly, one call option gives you the right to buy 100 shares at a specific price Put Options: You already know that the put option confers the right to sell the stock at a given rate and within a fixed time. However, the put value or the stock value at the time of sale will increase when the value of your underlying stock decreases. Right To Sell 100 Shares at A Specific Price Like the call option, the put option also gives you the right to sell 100 shares simultaneously and at a fixed price. The FINRA decides this bracket. No investor or brokerage firm can alter this value. You will know more similar regulations when you learn how to read an options chain. Impact Of Strike Prices on Option Prices You learned about the strike price while searching for how to read the options chain. However, you should also know its impact on option prices. The strike price decides the intrinsic value of any stock. The premium of any option grows as the monetary value of the option also grows. However, it decreases when the option starts losing its economic value. To calculate the premium, please add the stock's intrinsic value to the time value. I have already discussed the situations responsible for an increase or decrease in a stock's contract value (price). Execution Of Options Based on Market Price Crossing the Strike Price Regarding options trading, the market price must be more than the stock price. Only then can you execute the option. For instance, consider a stock's current trading price of $30 for each share. Then, you can purchase the call option for $45. However, that option would not be worth the same if the market price weren't $45. Conclusion This article explains how to read option chains in depth. The options chain is a practical decision-making guide for traders and investors. It helps them to understand the best options available to them for buying a specific asset. As I explained above, you must look for the strike price, expiration date, and other details. To understand how to read an options chain, you must know the basics: call and put. A Call permits you to buy the stock. On the other hand, Put ensures that you can sell the stock. The final price of the option is the premium. Read my full article to learn how to calculate it. For More Business Articles Click Below!! Why Do You Need a Fundamental Analysis of Stocks? How Does a Share Work? Benefits, Challenges, and Best Tips The Comparison of Stock Vs. Share: Definition, Significance, and Values What is Pattern Day Trading? – Fundamentals of Pattern Day Trading Technical Analysis Vs Fundamental Analysis: What’s The Best Way to Analyze Stocks?
May 29, 2024
What is Pattern Day Trading? – Fundamentals of Pattern Day Trading
What's pattern day trading? Pattern day trading is a FINRA-authorized trading scheme. A person who follows this scheme while trading is a pattern day trader. But you must know what is pattern day trading in real? Now, what is a pattern day trader? A pattern day trader performs at least four day trades within five official days from the margin account. The valuation of the day trades should be higher than 6% of the overall trade activity in those five days. There are, however, some critical pattern day trading rules. Follow those rules to ensure your designation as a PDT is not canceled. Firstly, a pattern day trader must maintain a $25000 balance in margin accounts. Every pattern day trader has their respective day trading buying power. They can trade amounts that do not cross their buying power limit. In this article, we will learn more about the pattern of day trade rules and restrictions. We will explore what does pattern day trading means, in detail, also. What Constitutes a Day Trade? A day trade is the fundamental behind pattern day trading. So, it's essential you know what constitutes a day trade. Buying And Selling the Same Stock or ETP Within a Single Trading Day Did you know you can buy and sell the same stock on the same day? Yes, there are no regulations against it. Experts say opening and closing hours are ideal for buying and selling stock. Since we trade ETFs through the same stock market windows, the same rule also applies here. Opening And Closing the Same Options Contracts Within a Single Trading Day That's what day traders do. Opening and closing the same options gives them incremental benefits. This method lets you gain from the slightest of price movements. But I recommend you know the dos and don'ts of this method. Otherwise, you can't profit as a day trader. First, you must develop a concrete knowledge of options trading. Secondly, you should interact with other traders to learn about the risks and challenges of trading daily. Finally, you should be able to make the trade quickly. However, the most important part is managing the risk involved. Experts say that this kind of trading is very volatile and highly unpredictable. Pattern Day Trading Restrictions There are not many pattern-day trader restrictions. But you must always be alert to those restrictions. The ground rule is to have at least $25000 in your margin account. So, your minimum portfolio value should be the same. If your balance becomes lower, your trading will cease. You need to gain more knowledge of what pattern day trading is. It would help if you also learned how to use these restrictions to your strength. Secondly, you only trade through your margin accounts as a PDT. Applicable To Margin Accounts and IRA Limited Margin Accounts The margin account used for trading will be flagged if FINRA sees four or more day-trading events within five days. Secondly, the net value of the four or more trades must be more than 6% of the net value traded within the 5-day bracket. Exemption For Cash Accounts If you are trading from a cash account, you're lucky. If you search for what is pattern day trading, you might have yet to come across this cash loophole. But I will tell you. There are no restrictions on at least 4 or whatever trades here. A cash account user does not need to trade at specific times to be a pattern day trader. Wait, there's a catch. You can only use the settled funds in your cash account for trading. Consequences of Violating Pattern Day Trading Rules There are dire consequences of violating the rules that I explained above. You'd better learn about those consequences. Flagging As a Pattern Day Trader There are no immediate repercussions if you are flagged as a PDT. FINRA knows what is pattern day trading and what is general trading from the trading times and counts within those five days. However, you cannot open any new position if FINRA recognizes you as a PDT. At the same time, you must deposit more funds into your margin account. You must match the threshold value of $25000. Experts say that it becomes difficult to change position if you are flagged. So, invest typically until you gain enormous experience in trading. I recommend you start as a pattern trader when you are sure that you understand day trading in and out. Start by searching what is pattern day trading. Minimum Equity Call and Deposit Requirements The pattern day trader rules are straightforward. However, they enjoy less flexibility in the market. For example, I must maintain $25000 as a minimum equity. You can deposit cash or any eligible security to ensure that you have the minimum equity value in your margin account. How to Avoid Breaking Pattern Day Trading Rules? The basic rules I discussed above apply to PDT only. However, you might get a "day trade margin call" if you bypass any of these quintessential rules. So, I recommend the best way to avoid breaking the pattern trader rule is to trade through a cash account. I also advise you to trade from more than one brokerage account. It can also save you from the PDT rule. Here, I have also discussed other rules. Monitoring Day Trade Counter What is a pattern day trader counter monitoring? You might raise this question now. It's a healthy habit to ensure you are not breaking PDT rules. PDTs must monitor all training activities every day, if possible. In the US, there are many brokerage platforms. These platforms offer various tools or analytics to track the day-trading orders. Options for Maintaining Portfolio Value Above $25,000 I recommend you deposit cash to make up for the minimum value of $25000. Or else, you can also invest in securities (permissible) to match the value. Above all, you should have a portfolio with a threshold value of $25000. That's the first criterion you know of while searching for pattern day trading. One-time Courtesy Flag Removal or Switching to a Cash Account According to the new changes in the FINRA rules, you can request only one flag removal. You must contact your brokerage firm. They will raise a request for flag removal. Regulatory Guidance and Brokerage Policies Your brokerage firm will provide considerable regulatory guidance before you start trading as a PDT. FINRA Rules On Pattern Day Trading The brokerage firm's responsibility is to help you count the number of day trades. You must conduct at least four day-trades in 5 days. The second rule is the 6% valuation rule. You must ensure that the value of day trades is more than 6% of the total traded value. But this percentage is for your margin account only. Brokerage-Specific Consequences and Alternatives for Violators If your brokerage has a relatively forgiving policy, then the consequences of one-time rule violation won't affect you much. Maybe you did four trades without intention in a rolling period of 5 days. But you don't want to be a regular day trader. Even then, you might have to maintain the minimum value of $25000, if the brokerage demands. Importance Of Communication with Broker for Resolution When there is any chance of a trading ban against you, the best thing is to contact the broker. The person might suggest any alternative transactions to save you from the consequences. Educational Resources and Further Learning How can you become an expert day trader? You certainly know the pattern day trading meaning. Now, you must be more adept. Access To Educational Resources on Day Trading I recommend you do ground research on day trading from finra.org or investor.gov by searching what is pattern day trading. You will get all the fundamental knowledge needed to successfully start PDT here. However, many of you are searching for how to be a specialist in it. For them, I recommend joining any credible PDT trading in the US. With better knowledge and skills, you can ensure a financial gain every time with PDT. You can also safeguard yourself from violating any regulations. Conclusion You know what is pattern day trading? It has two basic rules only. Firstly, keep a minimum equity of $25000 through your margin account. Secondly, do day-trading four times in 5 days. That's enough. You can read the whole article to know more about the policies and restrictions applicable to day-trading. But I will recommend that you avoid getting flagged as a PDT (in the sense of a defaulter). Be aware of your finances. If you cannot ensure profit from all four transactions, don't indulge in pattern day trading. A basic knowledge of what is pattern day trading is not enough. Be a day trader at first. If day trading is compatible for you, then indulge further. For More Business Related Articles Click Below!! Top Green Energy Stocks in the USA Why Do You Need a Fundamental Analysis of Stocks? Technical Analysis Vs Fundamental Analysis: What’s The Best Way to Analyze Stocks?
May 29, 2024

Top 10 Best AI Stock Trading Bots
AI trading bots can make trading decisions based on algorithms. Each AI trading bot uses a customized algorithm to interpret data and perform transactions. I was searching for how AI trading bots can give me good returns. Most broker sites said that I could win big time if I used AI bots for trading. However, many fin corps also warned that I could lose big-time. But the potential of AI bot trading and its wide acceptance is undeniable. At least 30% of investors in the US happily allow an AI trader bot to make trading decisions on their behalf. Overview Of How AI And Machine Learning Improve Trading Processes AI and ML can play a profitable role in enhancing trade results. For instance, ML's calculating algorithms and AI's use of intellect can be combined. The combined algorithm can suggest feasible future market trends. You can also use the combined algorithm to identify the potential risks and opportunities. Types of AI Trading Bots We learned that AI trading bots can revolutionize the market. It can offer undaunting returns. Now, we come across many AI trading bots every day. Many new bots are emerging as well. Let's find out the best AI bots for trading. 1. Trade Ideas Let's see how Trade Ideas help our trading regime. We will also evaluate its operating methodology. Features Trade Ideas' server is built by a team of core US developers. They connected their servers directly with the Exchange markets. Therefore, they can watch every movement in the markets in real time. The AI bots can also evaluate the current movements against pat records in real time. There are almost 12 AI algorithms that can funnel and process each other's data. Why does it matter to investors? It helps investors with suggestions for real-time improvements. At the same time, it recommends the best trading options for processing all this data together. However, the prime benefit is that these happen in real time. Target Audience It targets a broad span of users with variable investing interests. However, it is best for those who depend on technical analysis for investing. I mean those who invest for short-term gains only. Customization Options It is mainly a ranking bot. It uses real-time data from the market to pre-calculate and create a non-exhaustive ranking of the best options for you. You can use prompts to make the bot understand your trading priorities. 2. TrendSpider Let's find out the benefits of the advanced automated technical analysis of TrendSpider. Automatic Technical Analysis The automatic analysis algorithm can scan historical markets to detect where the forex arrow is heading. Trading Bot Capabilities TrendSpider has a unique feature. It has a community of avid traders. The ai trading bot allows them to start a trend line. But how do you do so? Let's imagine you are a regular user of the TrendSpider app. You calculated a trend or strategy and used it for your trading. When you see that the conditions comply with the plan, you can mark it as an event. Platform Features It is one of the most customizable and flexible AI trading apps. It helps day traders and growth stock owners alike. 3. Signm Signm's rapid interpretation of market trends is based on social news as well as financial analysis. So, it does not rest its analysis on server data from the exchange markets only. Market Trend Analysis In real-time, Signm's AI algorithm can accommodate a dataset of 2 million individual opinions from the stock market. So, what's the big deal? As a user, you remain updated with the latest market analysis trends. Otherwise, you would have to do the same for the best returns from the market. Wait! Signm can do more. It can also analyze 1500 news articles daily. At the same time, Signm can process data from 50 sources of financial news. Therefore, I feel that Signm can make the right mix of automated fundamental and technical analysis. Sentiment Analysis for Better Decision-making On the one hand, you can source the best analysis of the organizational health of your most sought-after stocks. On the other hand, you can always access accurate time analysis of instantaneous exchange market data. Analysis Of Other Best AI Trading Bots In the previous discussion, we have come across the best features that an AI trading bot can offer. Now, let's have a look at other competent AI trading bots and what they have to offer. Signal Stack Signal Stack can send real-time signals in the form of notifications. You can customize your trading decisions based on these updates. Hence, it is a good AI trading bot for trading portfolio management. The best features of Signal Stack are: Advanced AI algorithms Better scope of portfolio management, using leads from Signal Stack Comfortable risk management What's best about the app? It's highly automated. Its backtesting abilities are also phenomenal. However, there are a lot of technical complexities that first-time traders may not understand easily. Stock Hero It is a dedicated stock-screening AI trading bot. However, the best part of Stock Hero is that it can quickly identify undervalued stocks. As a bonus, it tracks fast. So, you can invest in undervalued stocks when stock prices are low. The best features of Stock Hero are: Easier for portfolio management Real-time analysis before others I found that the AI trading bot is efficient in tracking stocks. However, its analysis relies more on the market attributes (trends). Holly AI This AI trading bot uses 70 unique algorithms to interpret more than 8000 stocks from the US market daily. Holly AI apparently performs millions of backtests daily. You get the best scope of data-supported trading here. Holly's new app- Holly 2.0, tracks and scans day trading scenarios more avidly. The best features that Holly AI offers: The backtest win rate is more than 60% It has a 2:1 risk-reward ratio However, you will have difficulty understanding the app's complexities if you are not an avid trader. TradingView It allows US traders to make comprehensive investments in international stocks. FX and cryptocurrency trading suggestions are also available here. For better trading results, this AI trader bot uses: Chart pattern detection Candlestick pattern detector Whether it's Harami, Marubozu, or Doji, this ai trading bot can detect and interpret any bullish or bearish pattern. So, you get a versatile range of trading strategies to ponder upon. Cryptohopper This AI trading bot is most suitable for trading cryptos. Like other efficient apps, CryptoHopper's algorithm offers fully automated trading options. The app also offers portfolio management services free of cost. However, I like its trailing feature more. You can automate the process of selling/buying when the graph goes astray. Weinner AI I found no two user-friendly AI trading bots like this one. So, Weinner AI is compatible with beginners in trading, too. Unlike many others, Weinner AI combines AI with crypto stocks to help you find the best investment options. What's best about the app? You can do token swaps with Weinner AI. So you can swap your tokens seamlessly. As a result, you can opt for the best prices on the DEXs. Perceptrader AI This AI trading bot is most compatible with helping users discover the ideal entry and exit points. So, this app is popular as the best model for price prediction. But what's best about the app? It follows the customized system of grid trading. So, you can easily buy or sell any order at prefixed time slots. Conclusion Are you using an AI trading bot for your trading decisions? Then you ought to enjoy these benefits. Firstly, you could learn to adapt to market changes faster. Secondly, you are now able to make data-oriented decisions in real-time. AI trading bot can analyze paramount market data in seconds. There's no doubt about that. However, the kind of market leads and trend news available from these bots are unparalleled. For More Business Related Articles, Click Below!! Best Artificial Intelligence (AI) Stocks to Invest in US The 10 Best AI Companies in the World How To Invest in ChatGPT?
Jun 19, 2024

TUI Share Price Forecast: Everything You Should Know
Stock market investments are an exciting way of growing money. Thousands of companies are coming public either for expansion or accumulating funding. TUI stocks, for instance, are an investment choice for which many investors need to know the TUI share price. The TUI group is the largest tourism and travel company, owning several hotel chains, cruise lines, retail shops, and five European Airlines. The current TUI share price is 221.300 GBX. So, is it profitable to invest in TUI stocks? The following content offers accurate database analytical insight into whether it is profitable to invest in the TUI stocks or if you should skip this stock and instead invest in another. Here, we have offered both historical and forecasting data insights to help you analyze whether to invest in TUI stocks or not. About TUI Shares In 2004, the largest tourism and travel company, TUI, went public and started selling its stock. In 2007, TUI AG, the tour operating business of the company, merged with First Choice Holidays PLC, another tour operating business. Ever since the merger, the tour companies have worked together. Now, if you want to buy the TUI stocks, you need a detailed analysis of the current and the historical TUI group's share price. Here are the current and historical share price analyses for the TUI share market. TUI Share Price Analysis Here is a short analysis of the TUI Shares- Historical Data TUI travel share price was at the minimum value of 268.1 on February 14, 2022. The maximum price, on the other hand, was 275.8. The minimum and maximum prices for the TUI shares kept increasing until February 16, 2022. On February 16, the TUI stock price stayed at the minimum rate of 291.9 and with a maximum rate of 293.5. But starting from February 17 of 2022, the TUI share price makes its way down and continues to get lower by the end of February. On February 17, the share price of TUI group stocks was 285.7 (minimum) and 293.2 (maximum). The share price of TUI went down to 207 (minimum) and 216.4 (maximum). As you can see, the share price of TUI Group decreased exponentially within fourteen days of February 2022. TUI Share Price Forecast Based on the current rate of TUI shares, here is a forecast of the TUI share prices. On March 3, 2022, the TUI share price is expected to stay at the minimum rate of 187.522 and a maximum rate of 232.294. Therefore, if you want to buy stocks, it is an excellent time to buy when the price is down. According to the TUI share price forecast, the price of this group's stocks is expected to go down to a 177.45 minimum and a 225.45 maximum price in 2022. By March 17, 2022, the TUI UK share price will hit a minimum rate of 170. 05 and 218.67 maximum rates. The market cap of the TUI stocks is 4.51 B with a 2.06 M share value. The 52-week high price for the TUI stocks was 386.92. The lowest of the 52 weeks of historical data confirms a 189.85v lowest rate. Frequently Asked Questions (FAQs) The stock market has returned a sizable amount to investors over the years. But if the market for a particular stock is bearish for a long time, it is wise not to invest in it. The reason is the volatility of the stock price, and the equities may lose value. As we have warned you not to invest in a bear market, it is wise not to invest in the TUI stocks. If you have any other questions regarding the TUI stock prices, you can follow some of these popular questions I have answered here in this article. [su_spoiler title="1. Is TUI Likely To Go Bust?" open="yes" style="fancy"]TUI share prices have been down for the last twelve months. The biggest UK-based travel and tourism-based company's share market is currently in a bearish environment. However, TUI has said that its business will not return to a normal phase until 2022. In 2020, the company had faced a considerable loss.[/su_spoiler] [su_spoiler title="2. Should I Sell TUI Shares?" open="yes" style="fancy"]Since the stock market for the TUI, stocks have remained in a bearish state for the past twelve months; many analysts recommend selling the TUI stocks. As a result, the high price target for the TUI stocks is 350p, and the low price for the target is 140p.[/su_spoiler] [su_spoiler title="3. Why Is Tui Share Price Falling?" open="yes" style="fancy"]TUI's share price has fallen as low as 20% only within a month. Unfortunately, the effect of the covid-19 pandemic has not stopped its course upon the stocks of this famous travel and cruise company. As a result, the share price for this renowned company has fallen exponentially and has not picked up an upward pace for a while.[/su_spoiler] [su_spoiler title="4. How Many Shares Does Tui Have?" open="yes" style="fancy"]TUI has many shares of 1,622,914,412.00 EUR. This famous tourism business company is currently under a bearish environment in the share market. As a result, most of the analysts offer a sell recommendation for this stock.[/su_spoiler] Should You Invest In TUI Shares? - The Verdict The forecast data for the 52 week high is 236.432. The lowest of the 52 weeks is 0.049. For the past twelve months, the market environment of the TUI AG share has remained in a bearish cycle. According to several ai-based stock analyses of the TUI shares, investing in TUI shares is not a good choice to make money. The market for TUI stocks is bearish currently, and it is always hard to maintain trade in a Bearish market. Therefore, we recommend looking for other investment options since the TUI stock market price has been in a bearish state for the past twelve months. Disclaimer: Dear readers, the TUI share Price data and several other facts mentioned here are just assumptions. The data above refers to the information present on the leading stock websites. The actual values of the TUI stocks might change based on the situation. Please be aware that shares/stocks and markets are subject to risks. However, if you are able to invest with caution, you can indeed find profitable results.Must Check:GGP Share Price Forcast: Everything You Should KnowEUA Share Price Forecast: Everything You Should KnowBNKU Stock: MicroSectors US Big Banks Index 3X Leveraged ETNs
Mar 23, 2022