


Forex Trading Charts: How Traders Predict Volatility with Price Action and Structure
In the world of forex trading, volatility presents risk and opportunity both at the same time. It can create substantial profits and losses within minutes, making it one of the riskiest platforms to trade in. However, professional traders don’t rely on guesswork; instead, they make it a science and study the market structure and price action to anticipate high-volatility zones before they materialise.
In this article, we will discuss how traders utilize forex trading charts, price patterns, and technical confluence to stay ahead of the market before it becomes volatile. These insights will help you to gain experience and form an understanding of how markets function.
Forex Trading Charts: The Canvas of Market Behavior
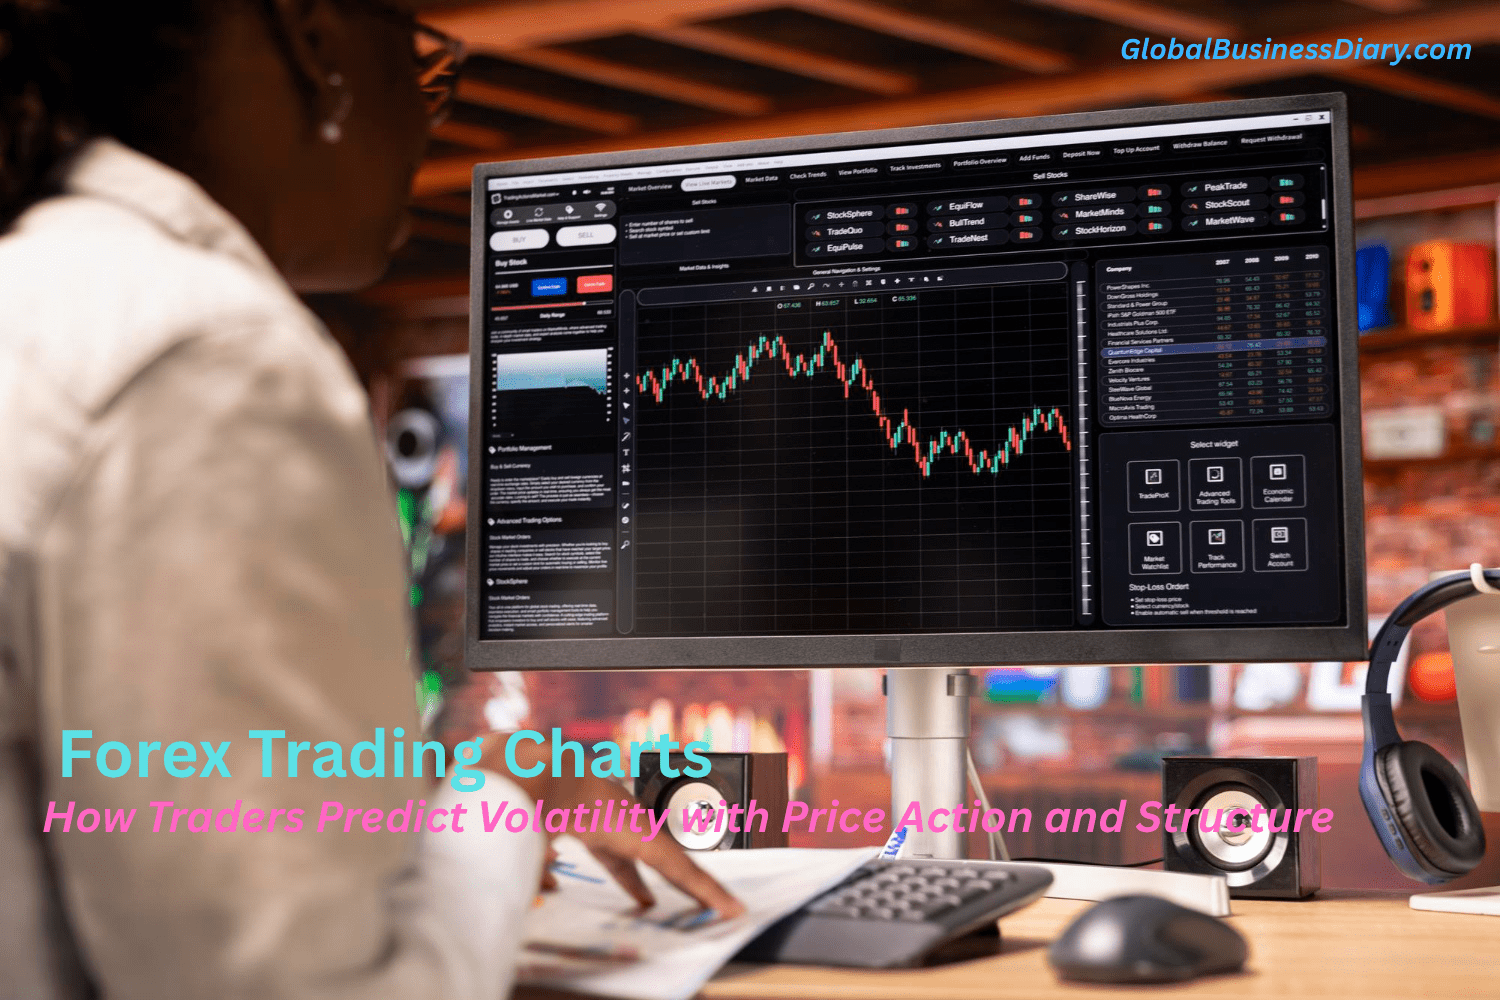
Forex Trading charts present a visual record of how forex prices have moved over time. They present a detailed report on emerging trends, resistance, and areas of indecision. You can see the price in a weekly or hourly fashion.
Among all the forex chart types, candlestick charts are one of the most commonly used. Each candle encapsulates the open, high, low, and close of a session, showcasing a detailed snapshot of the market sentiment.
Furthermore, you can use multi-timeframe analysis to build context, both long-term and short-term, to avoid making isolated decisions.
To learn more about reading and interpreting different forex chart types, including how candlesticks work, visit this link for a comprehensive breakdown.

Market Structure: The Blueprint for Forecasting
“Market structure” refers to how prices form different patterns over time. In uptrends, this structure consists of higher highs and higher lows, and in downtrends, lower highs and lower lows. These formations give rise to key zones where price is statistically likely to react.
Common Structural Zones:
- Trendlines and Channels: Diagonal guides that define a market’s directional flow.
- Range Boundaries: In sideways markets, the high and low of the range act as triggers for potential breakouts or breakdowns
- Support and Resistance: Horizontal zones where price has reversed or paused in the past.
When the structure converges with macroeconomic data or psychological price levels, it enhances a trader’s ability to anticipate market behavior with more confidence.
Identifying Volatility Zones on the Forex Trading Chart
Volatility zones are areas where price moves swiftly, often with increased momentum and trading volume. These typically occur around:
- Retests of broken support or resistance (a common price action setup)
- Breakouts from consolidation (e.g., triangle or flag patterns)
- Economic events that coincide with key technical areas
Professional traders wait for confirmation through price action. For instance, a bullish engulfing candle at a support zone in an uptrend might signal a strong buying opportunity. On the other hand, a bearish pin bar near resistance may hint at an impending reversal.
Volume, Liquidity, and Hidden Clues
In forex, traditional volume data is limited due to its decentralized nature. However, experienced traders can still infer liquidity and intent through price action alone.
Here’s how:
- Repeated wicks in the same zone suggest active buyer and seller interest
- Sharp spikes or whipsaws often point to stop hunts or liquidity grabs.
- Tight consolidations may indicate the absorption of orders before a breakout
These liquidity pools sometimes reside beyond recent swing highs/lows, where stop losses are placed. When these stops are triggered, they can fuel aggressive moves known as “stop runs.” Traders manage risks after identifying these liquidity zones to manage risks when the market takes momentum.
Price Action in Practice: A Case Study
Let’s create a scenario where GBP/USD is trading within an ascending channel. The pair pulls back toward the lower boundary of the channel, which further aligns with a horizontal support zone and the 50-day moving average.
Here’s the breakdown:
- Volatility Zone: The confluence area could trigger a sharp upside movement if defended.
- Structure: Price is respecting the ascending channel
- Confluence: Support level + moving average + bullish candle
A professional trader might enter long here, placing a stop just below the pin bar and targeting the top of the channel. If the level breaks instead, it signals a shift in structure and sets up a volatility zone in the opposite direction.
Practical Tips for Applying Structure and Price Action
If you want to start using these techniques in your own trading, keep these principles in mind:
1. Start with Market Structure
First, identify the market trend, current range, and key support/resistance levels. This will help you see the bigger picture that the forex market presents.
2. Seek Technical Confluence
The strongest trade setups occur when multiple factors align, like horizontal levels, moving averages, trendlines, and price platforms.
3. Use Multi-Timeframe Analysis
What looks like a breakout on the 15-minute chart could be a minor pullback on the 4-hour chart. Always zoom out for clarity.
4. Wait for Price Action Confirmation
Use candlestick patterns or momentum clues to confirm that the market agrees with your bias.
5. Prioritize Risk Management
Even the best volatility zones can lead to false breakouts. Always define your stop-loss level and calculate position size accordingly.
Conclusion: Structure Leads, Volatility Follows
Professional traders rely on forex trading charts to interpret market structure and price action to get a clear perspective on volatility and how it will act later. The forex charts keep the trader a step ahead of others and stop when the market falls or seek opportunities when the price skyrockets. Thus, for every trader, it is necessary to read the forex trading chart to know where the forex market will stall or go next. That way, they can strategize and come up with a better plan to get the best out of the forex market.
#Disclaimer: The information provided on this blog is for educational and informational purposes only and should not be construed as financial advice. I am not a licensed financial advisor. Any investment decision you make is at your own risk, and you should consult with a qualified financial advisor before making any investment decisions. This site may contain affiliate links, and I may earn a commission at no additional cost to you.
Read Also:

Recent
Time Matters: The Role of Early Hazard Detection in Industrial Safety
Jan 20, 2026

Hidden Ignition Risks in Industrial Environments
Jan 17, 2026

Critical Thinking Exercises in the Digital Age and Emotional Intelligence Integration
Jan 14, 2026

Why Strategic Partnerships Matter More Than Ever
Jan 13, 2026

Related Articles

Disruptive Growth of Tech Stocks: Best Tech Stocks 2024
Tech stocks took the stock market by storm in 2024. Searching for the best tech stocks in 2024 will find shocking returns from promising stocks like Microsoft, Apple, Nvidia, and others. Experts found that the total return of S7P 500s in the last year has already surpassed. The SPDR ETF is giving better returns now. In the last ten years, the tech sector went low for short periods. Those windows are ideal for buying tech stocks. If you are new to stock trading, this trend is here to stay. In the upcoming terms, both inflation and an increase in interest rates will be observed. Therefore, you must learn precisely about the best tech stocks in 2024. Nature of Growth of Best Tech Stocks 2024 The first quarter of 2024-25 lies ahead. You must continue reading to learn about some changes in the US stock market. Continuing the same trend, AI and tech companies have posted repetitive gains. However, you must be aware of some other trends. The investors will likely not be happy to see the amount of money going into stocks in the USA. Some factors are responsible for the moderate flow of money in the stock market. Firstly, the inflation is still higher than the level projected by the Federal Reserve. As a result, both S&P and NASDAQ have reduced their gain levels. According to Yahoo Finance, the WSJ also suggests a wait-and-watch policy for budding investors. The Best Tech Stocks 2024 as Growth Stocks Growth stocks are classic favorites of most investors. In simple terms, these stocks give premium returns for each share. The price-to-earnings ratio decides if the return from growth sticks is higher than the industry average. So, you will eagerly want to invest in growth stocks. The best growth stocks now are the best tech stocks in 2024. Some tech stocks gave their highest return ever. Two of them are "Advanced Micro Devices," a semiconductor manufacturer, and Tesla Inc. AMD also saw a whopping growth in shares by 445% in the last five years. Why Best Tech Stocks 2024 Had a Disruptive Growth? Most successful tech companies have excelled in their respective areas. They have taken over global businesses. Also, a strong international supplier or distributor network has been formed. AMD AMD focused on x86 microprocessors only. The company knew there would be low to no competition in this market. Their closest competitor was Intel. However, AMD did upscale production volume. The company tried to take on the global market. Analysis shows that these companies in the tech sector have found their competencies and unique growth areas. Consequently, they will stay in business for a long time and remain profitable, too. In the case of AMD, their success and sustainable strategies allowed them to capture market share. Tesla Tesla's path to glory is almost similar. The basic mantra was to do something in the best possible way. Tesla has become a market leader in manufacturing electric vehicles on a large scale. Like none other, Tesla spontaneously offered sales of its EVs worldwide. As a result, the share price percentage gained by Elon Musk's company is now 823%. However, there is a catch! Aristotle Atlantic Partners, LLC reported that some negative factors will constantly be bugging the growth of companies like Tesla. For example, the Q3 returns of Tesla in 2023 were shallow. The reason was the high-interest rates of financing companies. Performance of Best Tech Stocks 2024 in Different Markets There are multiple indices in the USA. You can follow any of these. Everywhere, the best tech companies are the biggest grossers. The Dow Verizon marked a 2.9% rise in the market, despite a poor revenue return in a short time. As a result, you should treat these companies as growth stocks. There is a high chance that the cumulative return over 3 to 5 years will be satisfactory. However, you must note that the cumulative performance of tech companies in the short term is also excellent. Big tech giants like Microsoft gave 1.5% growth. At the same time, Amazon gave 1.3% returns. S&P 500 GE Aerospace is the biggest grosser over the S&P 500 among the best tech stocks in 2024. It showed a growth of 8.3%. GE Vernova also gave similar results (8.2%). Other than the best tech stocks in 2024, General Motors and PHM achieved good growth. But, if you mark the number of tech companies that marked the chart, you will know their potential. In the S&P 500, Nvidia showed the second most prolific growth among the best tech stocks in 2024, after GE Aerospace. In April 2024, it marked a growth of 3.7%. Other brands like UPS also fared better, marking 2.4% growth, despite earning less than the stipulated revenues. NASDAQ 100 The trend is also the same here. Tesla sits at the top of the chart with 1.8% higher revenue than Q1. Although it means that revenues have slumped since last quarter, Tesla's value continues to increase. However, NASDAQ added a unique name- Cadence Design Systems. The company was stable for a long time. However, it slipped 1.1% in the current quarter. Categorizing Best Tech stocks 2024 There are different categorical parameters to detect the best tech stocks in 2024. Some of those are value-oriented. While others exhibited fast growth, only some have shown the best momentum. Best Tech Stocks 2024, Based on Value If you are new to stock trading, you must know what value investing is. It is the investment strategy of detecting stocks that are not performing outside their actual values. You can use the P/E ratio to identify the undervalued stocks. After some adjustments in the market, these stocks would reflect their actual values. It would be much higher than the current valuation. According to Investopedia, the best value stocks of 2024 are Yiren Digital Ltd and Surge Pays Inc. The former's trailing P/E ratio for the last 12 months is 1.4. At the same time, the latter is 2.7. Yiren reflects strong fiscal growth in 2023. It also shows a YoY revenue growth of 43%. Surge Pays is also a tech company. In 2023, the revenue reported by the company was $137.1 million. In other terms, the revenue increased by 13% since 2022. Best Tech Stocks 2024, Based on Growth Rate Here, the trajectory captures the stocks with the fastest growth rate. The stated growth rate is measured by the increase in revenues and the company's per-share earnings. You can check the revenue to detect whether it's a fast-growing stock. You can also check the "earnings per share" data. Investopedia says the fastest-growing stocks are the best tech stocks in 2024. In this connection, Spotify had a revenue growth of 22%. There are a few factors responsible for its steady growth. As a stock trader, you must identify these factors, too. The company's premium subscribers grew by 15%. However, Investopedia finds that Applied Digital Corp is the fastest-growing tech stock by a significant difference. The company manages data centers across the USA. APLD recorded approximately 242% growth in revenue. Best Tech Stocks 2024, Based on Momentum Momentum refers to a specific strategy of investing, too. Here, the traders consider the already existing market trends. It is as simple as finding the stocks that outpaced others in the same industry regarding returns. Experts say that the stocks that have been growing for some time will continue doing so until there is some external market change. For the Best tech stocks in 2024, you can identify the momentum from several factors. These are the launch of new products or the gain of popularity. Cleanspark Inc., Virtra Inc., and Samsara Inc. are the tech stocks showing the highest momentum. Cleanspark is a Bitcoin mining company. The share price of the company is $21.2. Also, the 12-month total return of the brand is 713%. VirTra has developed video simulation technology for military and legal applications in the USA. In recent years, the simulators of VirTra have spread to 40 countries. As a result, the company gained a process profit of $24 million. Final Thoughts....... Best tech stocks 2024 have outperformed players from other industries. At the same time, they will mark sustainable growth soon, too. The world is digitizing at a pace. Hence, tech companies will have undaunted growth opportunities. However, it would help if you had your priorities sorted. Companies that scaled in less time are momentum stocks. Invest in them on a short-term basis and reap the benefits. However, if you are searching for a long-term investment, go for Microsoft or Nvidia. The current market condition is favorable for the tech companies. However, the interest rate policies in the surrounding market will also impact their performance. #Disclaimer: The information provided on this blog is for educational and informational purposes only and should not be construed as financial advice. I am not a licensed financial advisor. Any investment decision you make is at your own risk, and you should consult with a qualified financial advisor before making any investment decisions. This site may contain affiliate links, and I may earn a commission at no additional cost to you. For More Business Related Information Click Below!! Why Businesses For Sale Make Great Investments? How To Maximize Your Settlement In A Wrongful Death Lawsuit? Risk Management Careers: A Comprehensive Guide to Top Risk Management Jobs
May 09, 2024

Best Places To Own A Vacation Rental Property
Are you dreaming of owning a property that not only provides a relaxing getaway for yourself but also generates impressive returns on investment? Look no further! In this guide, we'll take you on an exciting journey to discover the best places to own a vacation rental property. Whether you're searching for houses for sale in Gulf Shores AL or eyeing a short-term rental property in the captivating Gulf Shores, AL, we've got you covered. So, fasten your seatbelts and get ready for an exhilarating ride! Best Places To Own A Vacation Rental Property Before we dive into the best places to own a vacation rental property, let's talk about why investing in short-term rental property is a smart move. According to a report, short-term rentals generate up to three times more revenue than long-term rentals. Not only that, but short-term rentals also offer flexibility and the opportunity to use your property when it's not rented out. Gulf Shores AL - A hidden gem First on our list is Gulf Shores, AL. This hidden gem is located on the Gulf Coast and is known for its stunning white-sand beaches and crystal-clear waters. With its growing popularity, Gulf Shores is becoming a hot spot for vacationers, making it an ideal location for owning a vacation rental property. You can find a variety of properties such as waterfront homes, Gulf Shores AL beachfront homes for sale, condos, and luxury homes, all of which are in high demand. You can find houses for sale in Gulf Shores AL with ease, making it a great place to invest your money. Apart from Gulf Shores, AL, there are many other top locations for vacation rental properties across the United States. Here are some popular destinations to consider: Destin, Florida Destin, Florida, is a popular vacation destination located on the Emerald Coast. The area is known for its white sandy beaches and emerald-green waters. It attracts visitors from all over the world who come to enjoy activities such as fishing, boating, and water sports. Vacation rental properties in Destin are in high demand due to the area's popularity. Pigeon Forge, Tennessee Pigeon Forge, Tennessee, is located near the Great Smoky Mountains and offers a variety of activities, including hiking, skiing, and visiting Dollywood. Vacation rental properties in the area include cabins, chalets, and lodges. Pigeon Forge has a variety of restaurants, shopping centers, and entertainment venues. Orange Beach, Alabama Orange Beach, Alabama, is located just a few miles east of Gulf Shores and is another excellent location for vacation rental properties. The area offers beautiful beaches, water sports, fishing, and a variety of restaurants and shops. Orange Beach is also home to The Wharf, a popular entertainment district that features shopping, dining, and live music venues. Gatlinburg, Tennessee Gatlinburg, Tennessee, is situated in the Great Smoky Mountains and offers a wide range of activities, such as hiking, skiing, and exploring the national park. Vacation rental properties in the area include cabins, lodges, and chalets. Gatlinburg has a variety of restaurants, shopping centers, and entertainment venues. Savannah, Georgia Savannah, Georgia, is a charming city filled with historic architecture, parks, and museums. Visitors can enjoy ghost tours, riverboat cruises, and southern cuisine. Vacation rental properties in Savannah include apartments, townhouses, and historic homes. The city also has a variety of restaurants, shopping centers, and entertainment venues. Asheville, North Carolina Asheville, North Carolina, is located in the Blue Ridge Mountains and offers visitors a mix of outdoor activities, such as hiking and biking, as well as cultural attractions, such as art galleries and music venues. Vacation rental properties in Asheville include condos, cabins, and homes. The Importance Of Location: Where Paradise Meets Profit Imagine a place with blue-green water, beautiful beaches, and lots of people visiting all the time. The importance of location cannot be stressed enough when it comes to owning a vacation rental property or investing in Gulf Shores AL homes for sale. Gulf Shores, AL is a place where paradise and profit intersect perfectly. Known for its breathtaking Gulf Coast beaches and warm Southern hospitality, Gulf Shores is a haven for vacationers seeking sun-soaked getaways. Did you know that Gulf Shores, AL has many beautiful properties available? From charming beachfront cottages to luxurious waterfront villas and contemporary condos, there's something to suit every taste and budget. Now, let's dive deeper into the factors you should consider before taking the plunge into the world of vacation rental property ownership. Factors To Consider Before Buying: The Keys To Success Before you search for the best places to own a vacation rental property in Gulf Shores AL or any other vacation destination, it's crucial to consider a few key factors that can make or break your investment. Let's explore these essential considerations: Local Regulations and Zoning Laws: It's important to understand the local regulations, zoning laws, and restrictions in Gulf Shores, AL, before purchasing a property. This includes researching short-term rental restrictions, building codes, and permit requirements. Failure to comply with these regulations could lead to legal issues and fines. Market Trends and Rental Demand: Analyzing market trends, rental demand, and occupancy rates are crucial when considering purchasing houses for sale in Gulf Shores, AL. Research the local rental market, competition, and the demographics of tourists who typically visit the area to estimate the potential income you can earn from your vacation rental property. Financial Planning: Carefully plan your finances to determine what you can afford. Consider all expenses related to the property acquisition, including the down payment, mortgage payments, property taxes, insurance, utilities, and maintenance costs. Additionally, consider the potential need for renovations or upgrades to attract more renters and increase rental income. Property Management: Decide whether you'll manage the property yourself or enlist the services of a professional property management company. Managing a vacation rental can be time-consuming, so it's worth exploring the benefits of outsourcing day-to-day operations. Consider hiring a professional property management firm to handle tasks such as advertising, booking, cleaning, and maintenance. You can visit https://theshorttermshop.com/gulf-shores/ for more information. Alternatively, you can manage the property yourself, but this requires more effort and attention to detail. How To Choose The Best Places To Buy: Unlocking The Treasure Map Now that you're equipped with the knowledge of essential factors to consider, let's embark on a quest to choose the best places to buy your vacation rental property. Here's a treasure map to guide you: Research, Research, Research Unleash your inner adventurer and dive into extensive research. Explore vacation hotspots and identify regions with high rental demand and steady tourist traffic. Utilizing vacation rental websites such as Airbnb, HomeAway, and TripAdvisor can help you find properties that are available in the area. They also provide useful insights into the local rental market, including average rental rates and occupancy rates. Additionally, these websites make it easier to promote your property among potential visitors. Proximity To Attractions And Amenities X marks the spot! Look for locations that offer easy access to popular attractions, such as beaches, amusement parks, cultural landmarks, and outdoor recreational activities. Additionally, proximity to amenities like shopping centers, restaurants, and entertainment venues can enhance the appeal of your rental property. For instance, if you are looking for Gulf Shores AL luxury homes for sale, consider locations like Gulf State Park and Little Lagoon, which offer a range of popular activities. Local Real Estate Experts Seek the guidance of local real estate agents or short-term rental experts who have an intimate understanding of the market. Their knowledge and expertise can prove invaluable in guiding your decision-making process. They can help you find ideal Gulf Shores AL condos for sale or houses for sale in Gulf Shores AL, depending on your budget and preferences. Evaluate Potential Properties As you sail through your search, scrutinize potential properties based on their rental potential, condition, and growth prospects. Consider factors such as property size, amenities, views, and overall appeal to attract vacationers seeking unforgettable experiences. If you're considering buying houses for sale in Gulf Shores AL and using it as a vacation rental property, maximizing your ROI is likely a top priority. The Role of Full-Service Acquisition Firms: Your Trusted Shipmates If the thought of navigating the choppy waters of property acquisition and management seems daunting, fear not! Full-service property acquisition firms are here to save the day. These experienced professionals can help you sail smoothly from the initial property search to the day-to-day management of your vacation rental property. Fun Fact: According to our 2021 Vacation Rental Buyer Report, a whopping 42% of buyers looking to purchase a vacation home chose a beach destination as their preferred market type. The allure of beachfront escapes has captivated investors and for good reason! When you team up with a full-service firm, you gain access to a crew of experts who can handle everything from finding your dream property to managing it with utmost care. They'll save you time, and hassle, and provide you with peace of mind, knowing that your investment is in capable hands. These firms have a proven track record of success and can unlock the hidden potential of your vacation rental property. To maximize your ROI with a beachfront or waterfront property in Gulf Shores, it's important to work with a reputable full-service short-term rental acquisition firm. Such firms have the local expertise and resources to help you find the right property, effectively market it to potential renters, and manage it on a day-to-day basis. Benefits Of Selling Your Home For Cash The journey of purchasing a vacation rental property can be exciting and rewarding, but it's also important to consider strategies for selling your home for cash. Let's explore some benefits of selling your home for cash: Quick Closing Process: Selling your home for cash eliminates many of the steps associated with a traditional sale, such as appraisals and inspections. This allows you to close the sale quickly and get the cash you need in a timely manner. Save on Closing Costs: Selling your home for cash often involves fewer fees and costs than the traditional route, which can save you money in the long run. Avoid Home Repairs: Selling your home for cash means you don't have to invest time or effort into repairs or upgrades before the sale. This means you can avoid the hassle of dealing with costly projects and get your cash quickly. Flexible Terms: Selling your home for cash provides you with more flexibility when it comes to the terms and conditions of the sale. You can negotiate better deals that may include extended closing dates, flexible payment plans, or other terms that work in your favor. Your Voyage Begins Here! Congratulations on starting your exciting journey to discover the top houses for sale in Gulf Shores AL. By understanding the importance of location, considering crucial factors before buying, and learning how to choose the best destinations, you're well on your way to success. Whether you set your sights on Gulf Shores AL waterfront homes for sale, or any other captivating locale, the key lies in thorough research and smart decision-making. So, weigh anchor and set sail toward your dream Gulf Shores AL real estate property! Remember, you can chart your course independently or enlist the expertise of a full-service acquisition firm to guide you through the process. Whichever path you choose, the promise of incredible experiences, financial gains, and unforgettable memories awaits. Read Also: How To Start A Logistics Company? An Expert Guide Biggest Stock Market Crashes In The World History 10 Best Investment Apps For 2021
Jul 07, 2023

What is Pattern Day Trading? – Fundamentals of Pattern Day Trading
What's pattern day trading? Pattern day trading is a FINRA-authorized trading scheme. A person who follows this scheme while trading is a pattern day trader. But you must know what is pattern day trading in real? Now, what is a pattern day trader? A pattern day trader performs at least four day trades within five official days from the margin account. The valuation of the day trades should be higher than 6% of the overall trade activity in those five days. There are, however, some critical pattern day trading rules. Follow those rules to ensure your designation as a PDT is not canceled. Firstly, a pattern day trader must maintain a $25000 balance in margin accounts. Every pattern day trader has their respective day trading buying power. They can trade amounts that do not cross their buying power limit. In this article, we will learn more about the pattern of day trade rules and restrictions. We will explore what does pattern day trading means, in detail, also. What Constitutes a Day Trade? A day trade is the fundamental behind pattern day trading. So, it's essential you know what constitutes a day trade. Buying And Selling the Same Stock or ETP Within a Single Trading Day Did you know you can buy and sell the same stock on the same day? Yes, there are no regulations against it. Experts say opening and closing hours are ideal for buying and selling stock. Since we trade ETFs through the same stock market windows, the same rule also applies here. Opening And Closing the Same Options Contracts Within a Single Trading Day That's what day traders do. Opening and closing the same options gives them incremental benefits. This method lets you gain from the slightest of price movements. But I recommend you know the dos and don'ts of this method. Otherwise, you can't profit as a day trader. First, you must develop a concrete knowledge of options trading. Secondly, you should interact with other traders to learn about the risks and challenges of trading daily. Finally, you should be able to make the trade quickly. However, the most important part is managing the risk involved. Experts say that this kind of trading is very volatile and highly unpredictable. Pattern Day Trading Restrictions There are not many pattern-day trader restrictions. But you must always be alert to those restrictions. The ground rule is to have at least $25000 in your margin account. So, your minimum portfolio value should be the same. If your balance becomes lower, your trading will cease. You need to gain more knowledge of what pattern day trading is. It would help if you also learned how to use these restrictions to your strength. Secondly, you only trade through your margin accounts as a PDT. Applicable To Margin Accounts and IRA Limited Margin Accounts The margin account used for trading will be flagged if FINRA sees four or more day-trading events within five days. Secondly, the net value of the four or more trades must be more than 6% of the net value traded within the 5-day bracket. Exemption For Cash Accounts If you are trading from a cash account, you're lucky. If you search for what is pattern day trading, you might have yet to come across this cash loophole. But I will tell you. There are no restrictions on at least 4 or whatever trades here. A cash account user does not need to trade at specific times to be a pattern day trader. Wait, there's a catch. You can only use the settled funds in your cash account for trading. Consequences of Violating Pattern Day Trading Rules There are dire consequences of violating the rules that I explained above. You'd better learn about those consequences. Flagging As a Pattern Day Trader There are no immediate repercussions if you are flagged as a PDT. FINRA knows what is pattern day trading and what is general trading from the trading times and counts within those five days. However, you cannot open any new position if FINRA recognizes you as a PDT. At the same time, you must deposit more funds into your margin account. You must match the threshold value of $25000. Experts say that it becomes difficult to change position if you are flagged. So, invest typically until you gain enormous experience in trading. I recommend you start as a pattern trader when you are sure that you understand day trading in and out. Start by searching what is pattern day trading. Minimum Equity Call and Deposit Requirements The pattern day trader rules are straightforward. However, they enjoy less flexibility in the market. For example, I must maintain $25000 as a minimum equity. You can deposit cash or any eligible security to ensure that you have the minimum equity value in your margin account. How to Avoid Breaking Pattern Day Trading Rules? The basic rules I discussed above apply to PDT only. However, you might get a "day trade margin call" if you bypass any of these quintessential rules. So, I recommend the best way to avoid breaking the pattern trader rule is to trade through a cash account. I also advise you to trade from more than one brokerage account. It can also save you from the PDT rule. Here, I have also discussed other rules. Monitoring Day Trade Counter What is a pattern day trader counter monitoring? You might raise this question now. It's a healthy habit to ensure you are not breaking PDT rules. PDTs must monitor all training activities every day, if possible. In the US, there are many brokerage platforms. These platforms offer various tools or analytics to track the day-trading orders. Options for Maintaining Portfolio Value Above $25,000 I recommend you deposit cash to make up for the minimum value of $25000. Or else, you can also invest in securities (permissible) to match the value. Above all, you should have a portfolio with a threshold value of $25000. That's the first criterion you know of while searching for pattern day trading. One-time Courtesy Flag Removal or Switching to a Cash Account According to the new changes in the FINRA rules, you can request only one flag removal. You must contact your brokerage firm. They will raise a request for flag removal. Regulatory Guidance and Brokerage Policies Your brokerage firm will provide considerable regulatory guidance before you start trading as a PDT. FINRA Rules On Pattern Day Trading The brokerage firm's responsibility is to help you count the number of day trades. You must conduct at least four day-trades in 5 days. The second rule is the 6% valuation rule. You must ensure that the value of day trades is more than 6% of the total traded value. But this percentage is for your margin account only. Brokerage-Specific Consequences and Alternatives for Violators If your brokerage has a relatively forgiving policy, then the consequences of one-time rule violation won't affect you much. Maybe you did four trades without intention in a rolling period of 5 days. But you don't want to be a regular day trader. Even then, you might have to maintain the minimum value of $25000, if the brokerage demands. Importance Of Communication with Broker for Resolution When there is any chance of a trading ban against you, the best thing is to contact the broker. The person might suggest any alternative transactions to save you from the consequences. Educational Resources and Further Learning How can you become an expert day trader? You certainly know the pattern day trading meaning. Now, you must be more adept. Access To Educational Resources on Day Trading I recommend you do ground research on day trading from finra.org or investor.gov by searching what is pattern day trading. You will get all the fundamental knowledge needed to successfully start PDT here. However, many of you are searching for how to be a specialist in it. For them, I recommend joining any credible PDT trading in the US. With better knowledge and skills, you can ensure a financial gain every time with PDT. You can also safeguard yourself from violating any regulations. Conclusion You know what is pattern day trading? It has two basic rules only. Firstly, keep a minimum equity of $25000 through your margin account. Secondly, do day-trading four times in 5 days. That's enough. You can read the whole article to know more about the policies and restrictions applicable to day-trading. But I will recommend that you avoid getting flagged as a PDT (in the sense of a defaulter). Be aware of your finances. If you cannot ensure profit from all four transactions, don't indulge in pattern day trading. A basic knowledge of what is pattern day trading is not enough. Be a day trader at first. If day trading is compatible for you, then indulge further. For More Business Related Articles Click Below!! Top Green Energy Stocks in the USA Why Do You Need a Fundamental Analysis of Stocks? Technical Analysis Vs Fundamental Analysis: What’s The Best Way to Analyze Stocks?
May 29, 2024

Property vs Shares Australia: Which Offers Better Diversification?
Diversification is at the heart of every smart investment strategy. After all, the wise ones warned against having all your eggs in one basket. There are many options out there that you, as a property investor, may look into. This guide is especially geared to look into property vs shares in Australia. Which of these offers better diversification? Read this guide for in-depth answers. Why Property Feels Like Good Diversification Here are a few reasons why investment property is good for your portfolio: It’s a tangible asset: People will always need homes. This makes property a solid bet over time. Rental income: You can earn money while waiting for the property to grow in value. Inflation hedge: When prices rise, so does the value of your property, at least in most cases. But property isn’t as easy to diversify as you might think. Here’s why: High Entry Cost To buy even one property, you need a lot of money upfront. Most people end up owning just one or two properties. This means you’re concentrated in one area or type of property. For example, if you own a beachfront condo in Queensland, what happens if tourism tanks? Your property could pay the price. Illiquid Selling in the property market takes months. You can’t just hit “sell” like you would with shares. And when you do sell, there are fees. Say you're selling an AUD$600,000 house. It might take three months and cost AUD$30,000+ in agent fees, while selling AUD$600 worth of shares takes seconds with a AUD$10 brokerage fee. Maintenance Properties come with upkeep costs. Roofs leak, pipes burst, and tenants complain. These aren’t issues with shares. So while the property market offers some diversification, it’s limited compared to other options. Why Shares Are a Good Diversification Approach Shares give you tiny pieces of companies. You can own part of Apple, BHP, or any company listed on the stock market. Here’s how shares help with diversification: Easy To Buy and Sell With online trading platforms, you can buy and sell shares in a few short minutes. You won't need to wait around for buyers or deal with real estate agents. Low Cost You don’t need millions to start. Some brokers let you buy fractions of shares for as little as AUD$50. Wide Exposure Whether it's tech companies, mining giants, or international markets, everything is on the table. Shares let you spread your money across industries, countries, and sectors. How Do Diversified Share Portfolios Look? Say you invest AUD$ 10,000 in Australian shares. You could split it like this: AUD$4,000 in banks (CBA, NAB, ANZ) AUD$3,000 in mining stocks (BHP, Rio Tinto) AUD$2,000 in tech companies (Afterpay, WiseTech) AUD$1,000 in healthcare (CSL) See how diverse that is? You’re covering different parts of the economy. If one sector falters, others might pick up the slack. This can protect you from exposure. If you're still not sure what approach would work best for you, consider looking into property vs shares Australia guides or any other in-depth resources that can help inform your next step. These can help you make the best decisions that reflect the risk levels you're comfortable taking, hence making the most of your investment. REITs In love with the idea of property but also want the flexibility of shares? Consider REITs (real estate investment trusts). They’re like mutual funds for property. With REITs, you can own small portions of commercial buildings, shopping centers, or industrial parks. For example, the ASX-listed Vanguard Australian Property Securities Index ETF (VAP) lets you invest in a basket of Australian property stocks. Yes, REITs can be a great idea, but there are some things you should be aware of. They come with management fees and may be more volatile than direct property due to stock market fluctuations and economic conditions. Also, REITs don't give you the same control or tangible ownership as owning a physical property outright. Their future performance also depends on the skill of the fund managers. Building a Balanced Investment Portfolio The best approach often involves both property and shares. Here’s how you might structure a diversified portfolio: Example 1: A Young Investor Focused on Growth If you're in your 20s or 30s and have a long-term horizon, you might do well to focus on growth over stability. Here's how you could structure your portfolio: Australian Shares (35%): Invest in VAS (Vanguard Australian Shares ETF) or STW (SPDR S&P/ASX 200 Fund). These give you exposure to the largest companies in Australia. International Shares (35%): ETFs like VGS (international developed markets) or IVV (top 500 US companies) are great options for global diversification. This balances your portfolio beyond Australia. Property (15%): Consider REITs like ARL (Australian Real Estate Investment Trust ETF) or VAP (Vanguard Australian Property Securities Index ETF). If you've already invested in property, this portion is already covered. Bonds/Cash (15%): Stick with safer assets like VGB (Vanguard Australian Government Bond ETF) or keep cash in a high-interest savings account. This is a smart approach. You get to focus on growth while still maintaining some stability with bonds and property. Leave the rest to compounding. It will work its magic. Example 2: A Mid-Career Investor Balancing Growth and Stability If you’re in your 40s or 50s and want a mix of growth and stability, here’s a more balanced approach: Australian Shares (25%): Stick with VAS or STW. These provide steady income through dividends and franking credits. International Shares (25%): Use IOZ or IWLD (BetaShares Global Aggressive ETF) for global exposure. Diversifying internationally reduces risk. Property (25%): If you own a home, this portion is covered. Otherwise, invest in REITs like ARL or VAP for exposure to commercial and industrial properties. Bonds/Cash (25%): Allocate more to bonds with VGB or QAU (BetaShares Gold Bullion ETF) for inflation protection. Cash reserves can also come in handy for emergencies. Here, you're not too exposed to one asset class as retirement approaches. Example 3: A Pre-Retiree Focused on Income and Stability If you’re nearing retirement and want a reliable income with low risk, here’s a conservative portfolio: Australian Shares (20%): Focus on dividend-paying stocks like CBA, CSL, or ETFs like VHY (Vanguard High Yield Share ETF). International Shares (20%): Use IDIV (iShares International Equity High Dividend ETF) for global dividend exposure. Property (20%): Own a home or invest in REITs like ARL or VAP. Rental income or REIT distributions can supplement retirement income. Bonds/Cash (40%): Prioritize safety with VGB, IAF (BetaShares Australian Fixed Interest ETF), or cash reserves. This can be a promise of steady income during market downturns. With the sunset days looming, you're better off preserving capital than chasing high returns. That's why a bond/cash-heavy approach may be best at this stage. So, What Gives? Both property and shares come with diversification, but the latter wins hands down if you're in the hunt for ease and flexibility. Property has its place, too, especially once you’ve built wealth. But starting out, shares might be the smarter choice. In the end, it's up to you to decide what best works for you. Consult a financial adviser if you need one to make an informed decision. Read Also: Best Places To Own A Vacation Rental Property Estate Planning Law: Expert Guidance for Your Future Navigating Real Estate Transactions: The Crucial Role Of A Skilled Lawyer How Investment Strategies Can Expand Your Real Estate Portfolio
May 29, 2025