


The Comparison of Stock Vs. Share: Definition, Significance and Values
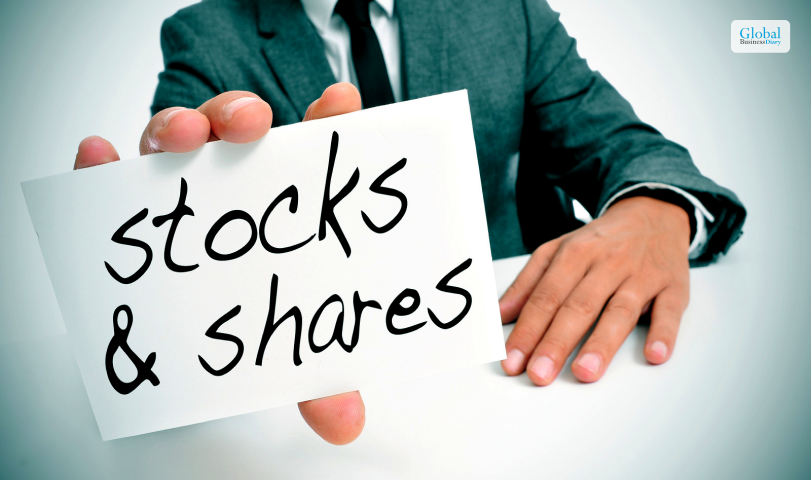
Shares are the units used to measure your ownership in a company. Many articles use the terms stocks and shares to mean the same thing. However, there are some fundamental differences between stock vs. share.
When you purchase a stock, it works as a certificate. It shows that you have ownership in a company.
Let me clarify the difference between stock vs. share in simple terms. Take the instance where a company lists its stocks. You buy ten shares of that stock. Each share is equivalent to 1% of your ownership.
But don’t mistake it for 1% ownership in the company.
In easier terms, you don’t buy stock. You purchase shares of that stock.
An understanding of stocks and trading are the basics of investment. First, learn these in detail. Then, start investing. You must understand the difference between the two to make informed decisions while buying and selling shares.
Stocks
Stocks come first. Then shares. You can only buy shares if its stock is listed on the share market.
Definition Of Stocks
In simple terms, investors use the term stocks to denote the companies listed on the stock market. For example, you can refer to energy, large, or mid-cap stocks.
Investopedia defines stocks as:
“a kind of security that suggests the holder has proportionate ownership in the stock issuing corporation and is sold mainly on stock exchanges.”
You can also define a stock as a share percentage to reflect your ownership in the company.
Represent Ownership in a corporation
If you buy a stock, you get part ownership of the issuing company. An individual or entity with the highest shares of a listed company is its primary owner.
To understand stock vs. share, consider yourself a part-owner of a company. In 2023, the NYSE had 2272 listed companies.
You could buy stock from any of these companies.
Claim On Earnings and Assets
Every shareholder has a statutory claim on the company’s assets. If you buy one share of Starbucks for $73.50, that money goes into the company’s total assets. So, when Starbucks profits or gives dividends to its investors, you also get a part of it.
However, your earnings are not in terms of money gained. Starbucks’ share price value will increase if it gives dividends or shares profit. For evidence, you bought one share for $73.50. After that, Starbucks shared its dividend, and the share price became $75.00 (arbitrary).
Payment Of Dividends
Most US companies share dividends every quarter. For evidence, Starbucks shares a $0.57 dividend per share. Here, there is no confusion about stock vs. share.
You gain per share, not per stock. The earnings are shared quarterly. When the dividend is disbursed, it is reflected in your share price value. Make sure to distinguish stock vs. share here.
You will count your earnings on each share.
Example: Owning Stock in Apple
Apple is a stable brand on the NASDAQ. Apple’s current share price is USD 182.74.
Like Starbucks, Apple also gives dividends every quarter. Apple increased its dividend by 4%. In cash, it was $0.25.
The shareholders will get their dividends on 16th May 2024 for the current quarter.
Shares
Now you know about stocks in detail. But what about shares?
Shares are the actual tradable units of stock. Like I said, you can only buy part of the stock. However, you purchase “n” number of shares of a stock. Now, you should not have any ambiguity about stock vs. share.
Definition Of Shares
Shares refer to part ownership in a company. Ay, the company can list a fixed number of shares in the market. Currently, AAPL has 15,509,763,000 outstanding shares in the market.
There are mainly two types of shares. These are:
- Equity shares
- Preference shares
A company gets funds from the market by issuing shares. However, you get an ownership stake in the organization when you buy shares.
Individual Units of Stock
Still need clarification on what shares are? To clarify stock vs. share, I can describe shares as units of equity ownership of a company in the market.
A company will share any surplus profit as dividends to the open market.
Every unit of stock has a fixed value. If the company profits, then you get additional dividends. As a result, you enjoy monetary gain. However, you will incur losses if the company loses the money invested by shareholders.
Convey Information About Investment Size
The number of shares denotes your investment size. If you say you have AAPL stocks, nobody will understand the net worth of your investment in the company.
For instance, you can buy shares in Apple. After that, you and Warren Buffett (who have maximum shares) will be both Apple stockholders and part owners of the tech giant.
But your investment size is different. According to Fool.com, Warren Buffett had 906 million company shares in 2023 (now 790 million). So, he will earn much more than you when Apple gives dividends to their shareholders.
Example: Owning 100 Shares of Apple
Currently, Apple (AAPL on NASDAQ) is trading at USD 182.74. It means that the value of a unit share of Apple’s stock is the same.
If you buy 100 shares, you will pay:
182.74*100= USD 18274.0
The last dividend given by Apple is $0.24 for each share. So, if you bought 100 shares, you gained $0.24*100= $24.00.
Stake

Most people confuse stock with shares. Stake is the term used to define the relationship between shares and stocks. I have shared essential knowledge about stakes here.
Definition Of Stake
A stake is the amount an investor gives in exchange for a company’s stock. If you have shares in a company, you also hold a particular stake in the firm.
Represents Ownership Percentage In A Company
Warren Buffett had around 905 million shares of Apple in 2023. It means that he should have a good stake in the company. If you hold a few shares, then it cannot be calculated in terms of percentage. However, that many shares are equivalent to a 6% stake in Apple.
It is also the ownership percentage of Warren Buffett’s company, Apple. The current valuation of the stake is $174 billion currently.
Not Limited to Stock Ownership
The stake is a broad term. It is not only used to measure the percentage of stocks of a company that you own. You can use the term to denote your percentage of ownership in any asset. For example, you can have a stake in an investment property.
Stockholders, Shareholders, and Stakeholders

Now you know what stock vs share are. You also know the meanings of stocks, shares, and stakes. If you invest in any company, you are its stockholder.
If you have “n” number of shares of any stock, you can call yourself a shareholder.
Again, stakeholders have a certain percentage of the stock issued by a company in the share market. In a common context, these terms can be used interchangeably.
These three can be used to refer to the same person. However, there is a slight difference. Warren Buffett has a 6% stake in Apple. His percentage is significant because he has 790 million shares. So, you can imagine your stake will not be fathomable if you have a handful of shares.
Stakeholders Have a Financial Interest in a Business
When you have invested in so many shares, you will earn a lot if the company profits. Similarly, you will lose big time if the company goes into losses.
John T. Walton Estate Trust, Vanguard Group, and BlackRock hold the highest shares of Walmart. So, it will matter to them if Walmart gains or loses money.
Conclusion
I hope the confusion of stock vs. share will end now. If you own a stock, it means you are the certified owner of “n” number of shares in a company.
You can understand a stock as the instrument used by a company to trade in the market. Again, shares are single units of stock in the market.
You are the sole owner of a company if you are the sole owner. At the same time, the person or entity with the highest stock is also a part owner.
The difference is that he will gain more than you. In simple terms, both of you will gain a certain dividend on each share. The person with higher shares (of the same company) will earn more. You must understand the three terminologies clearly to make a more informed choice in the share market. I hope this article solved your confusion about stock vs. share.
#Disclaimer: The information provided on this blog is for educational and informational purposes only and should not be construed as financial advice. I am not a licensed financial advisor. Any investment decision you make is at your own risk, and you should consult with a qualified financial advisor before making any investment decisions. This site may contain affiliate links, and I may earn a commission at no additional cost to you.
Read More Interesting Business Articles By Clicking Below!!

Recent
Due Diligence Decoded: Why Careful Evaluation Still Wins in Business
Jul 11, 2026

How Hydraulic System Design Impacts Equipment Performance
Jul 01, 2026

Startup Bootstrapped Fundraising Strategy: A Guide for SaaS and Tech Startups
Jun 21, 2026

Where Distributors Lose Profit Without Realizing It
Jun 20, 2026

Related Articles

What is Pattern Day Trading? – Fundamentals of Pattern Day Trading
What's pattern day trading? Pattern day trading is a FINRA-authorized trading scheme. A person who follows this scheme while trading is a pattern day trader. But you must know what is pattern day trading in real? Now, what is a pattern day trader? A pattern day trader performs at least four day trades within five official days from the margin account. The valuation of the day trades should be higher than 6% of the overall trade activity in those five days. There are, however, some critical pattern day trading rules. Follow those rules to ensure your designation as a PDT is not canceled. Firstly, a pattern day trader must maintain a $25000 balance in margin accounts. Every pattern day trader has their respective day trading buying power. They can trade amounts that do not cross their buying power limit. In this article, we will learn more about the pattern of day trade rules and restrictions. We will explore what does pattern day trading means, in detail, also. What Constitutes a Day Trade? A day trade is the fundamental behind pattern day trading. So, it's essential you know what constitutes a day trade. Buying And Selling the Same Stock or ETP Within a Single Trading Day Did you know you can buy and sell the same stock on the same day? Yes, there are no regulations against it. Experts say opening and closing hours are ideal for buying and selling stock. Since we trade ETFs through the same stock market windows, the same rule also applies here. Opening And Closing the Same Options Contracts Within a Single Trading Day That's what day traders do. Opening and closing the same options gives them incremental benefits. This method lets you gain from the slightest of price movements. But I recommend you know the dos and don'ts of this method. Otherwise, you can't profit as a day trader. First, you must develop a concrete knowledge of options trading. Secondly, you should interact with other traders to learn about the risks and challenges of trading daily. Finally, you should be able to make the trade quickly. However, the most important part is managing the risk involved. Experts say that this kind of trading is very volatile and highly unpredictable. Pattern Day Trading Restrictions There are not many pattern-day trader restrictions. But you must always be alert to those restrictions. The ground rule is to have at least $25000 in your margin account. So, your minimum portfolio value should be the same. If your balance becomes lower, your trading will cease. You need to gain more knowledge of what pattern day trading is. It would help if you also learned how to use these restrictions to your strength. Secondly, you only trade through your margin accounts as a PDT. Applicable To Margin Accounts and IRA Limited Margin Accounts The margin account used for trading will be flagged if FINRA sees four or more day-trading events within five days. Secondly, the net value of the four or more trades must be more than 6% of the net value traded within the 5-day bracket. Exemption For Cash Accounts If you are trading from a cash account, you're lucky. If you search for what is pattern day trading, you might have yet to come across this cash loophole. But I will tell you. There are no restrictions on at least 4 or whatever trades here. A cash account user does not need to trade at specific times to be a pattern day trader. Wait, there's a catch. You can only use the settled funds in your cash account for trading. Consequences of Violating Pattern Day Trading Rules There are dire consequences of violating the rules that I explained above. You'd better learn about those consequences. Flagging As a Pattern Day Trader There are no immediate repercussions if you are flagged as a PDT. FINRA knows what is pattern day trading and what is general trading from the trading times and counts within those five days. However, you cannot open any new position if FINRA recognizes you as a PDT. At the same time, you must deposit more funds into your margin account. You must match the threshold value of $25000. Experts say that it becomes difficult to change position if you are flagged. So, invest typically until you gain enormous experience in trading. I recommend you start as a pattern trader when you are sure that you understand day trading in and out. Start by searching what is pattern day trading. Minimum Equity Call and Deposit Requirements The pattern day trader rules are straightforward. However, they enjoy less flexibility in the market. For example, I must maintain $25000 as a minimum equity. You can deposit cash or any eligible security to ensure that you have the minimum equity value in your margin account. How to Avoid Breaking Pattern Day Trading Rules? The basic rules I discussed above apply to PDT only. However, you might get a "day trade margin call" if you bypass any of these quintessential rules. So, I recommend the best way to avoid breaking the pattern trader rule is to trade through a cash account. I also advise you to trade from more than one brokerage account. It can also save you from the PDT rule. Here, I have also discussed other rules. Monitoring Day Trade Counter What is a pattern day trader counter monitoring? You might raise this question now. It's a healthy habit to ensure you are not breaking PDT rules. PDTs must monitor all training activities every day, if possible. In the US, there are many brokerage platforms. These platforms offer various tools or analytics to track the day-trading orders. Options for Maintaining Portfolio Value Above $25,000 I recommend you deposit cash to make up for the minimum value of $25000. Or else, you can also invest in securities (permissible) to match the value. Above all, you should have a portfolio with a threshold value of $25000. That's the first criterion you know of while searching for pattern day trading. One-time Courtesy Flag Removal or Switching to a Cash Account According to the new changes in the FINRA rules, you can request only one flag removal. You must contact your brokerage firm. They will raise a request for flag removal. Regulatory Guidance and Brokerage Policies Your brokerage firm will provide considerable regulatory guidance before you start trading as a PDT. FINRA Rules On Pattern Day Trading The brokerage firm's responsibility is to help you count the number of day trades. You must conduct at least four day-trades in 5 days. The second rule is the 6% valuation rule. You must ensure that the value of day trades is more than 6% of the total traded value. But this percentage is for your margin account only. Brokerage-Specific Consequences and Alternatives for Violators If your brokerage has a relatively forgiving policy, then the consequences of one-time rule violation won't affect you much. Maybe you did four trades without intention in a rolling period of 5 days. But you don't want to be a regular day trader. Even then, you might have to maintain the minimum value of $25000, if the brokerage demands. Importance Of Communication with Broker for Resolution When there is any chance of a trading ban against you, the best thing is to contact the broker. The person might suggest any alternative transactions to save you from the consequences. Educational Resources and Further Learning How can you become an expert day trader? You certainly know the pattern day trading meaning. Now, you must be more adept. Access To Educational Resources on Day Trading I recommend you do ground research on day trading from finra.org or investor.gov by searching what is pattern day trading. You will get all the fundamental knowledge needed to successfully start PDT here. However, many of you are searching for how to be a specialist in it. For them, I recommend joining any credible PDT trading in the US. With better knowledge and skills, you can ensure a financial gain every time with PDT. You can also safeguard yourself from violating any regulations. Conclusion You know what is pattern day trading? It has two basic rules only. Firstly, keep a minimum equity of $25000 through your margin account. Secondly, do day-trading four times in 5 days. That's enough. You can read the whole article to know more about the policies and restrictions applicable to day-trading. But I will recommend that you avoid getting flagged as a PDT (in the sense of a defaulter). Be aware of your finances. If you cannot ensure profit from all four transactions, don't indulge in pattern day trading. A basic knowledge of what is pattern day trading is not enough. Be a day trader at first. If day trading is compatible for you, then indulge further. For More Business Related Articles Click Below!! Top Green Energy Stocks in the USA Why Do You Need a Fundamental Analysis of Stocks? Technical Analysis Vs Fundamental Analysis: What’s The Best Way to Analyze Stocks?
May 29, 2024

Best Places To Own A Vacation Rental Property
Are you dreaming of owning a property that not only provides a relaxing getaway for yourself but also generates impressive returns on investment? Look no further! In this guide, we'll take you on an exciting journey to discover the best places to own a vacation rental property. Whether you're searching for houses for sale in Gulf Shores AL or eyeing a short-term rental property in the captivating Gulf Shores, AL, we've got you covered. So, fasten your seatbelts and get ready for an exhilarating ride! Best Places To Own A Vacation Rental Property Before we dive into the best places to own a vacation rental property, let's talk about why investing in short-term rental property is a smart move. According to a report, short-term rentals generate up to three times more revenue than long-term rentals. Not only that, but short-term rentals also offer flexibility and the opportunity to use your property when it's not rented out. Gulf Shores AL - A hidden gem First on our list is Gulf Shores, AL. This hidden gem is located on the Gulf Coast and is known for its stunning white-sand beaches and crystal-clear waters. With its growing popularity, Gulf Shores is becoming a hot spot for vacationers, making it an ideal location for owning a vacation rental property. You can find a variety of properties such as waterfront homes, Gulf Shores AL beachfront homes for sale, condos, and luxury homes, all of which are in high demand. You can find houses for sale in Gulf Shores AL with ease, making it a great place to invest your money. Apart from Gulf Shores, AL, there are many other top locations for vacation rental properties across the United States. Here are some popular destinations to consider: Destin, Florida Destin, Florida, is a popular vacation destination located on the Emerald Coast. The area is known for its white sandy beaches and emerald-green waters. It attracts visitors from all over the world who come to enjoy activities such as fishing, boating, and water sports. Vacation rental properties in Destin are in high demand due to the area's popularity. Pigeon Forge, Tennessee Pigeon Forge, Tennessee, is located near the Great Smoky Mountains and offers a variety of activities, including hiking, skiing, and visiting Dollywood. Vacation rental properties in the area include cabins, chalets, and lodges. Pigeon Forge has a variety of restaurants, shopping centers, and entertainment venues. Orange Beach, Alabama Orange Beach, Alabama, is located just a few miles east of Gulf Shores and is another excellent location for vacation rental properties. The area offers beautiful beaches, water sports, fishing, and a variety of restaurants and shops. Orange Beach is also home to The Wharf, a popular entertainment district that features shopping, dining, and live music venues. Gatlinburg, Tennessee Gatlinburg, Tennessee, is situated in the Great Smoky Mountains and offers a wide range of activities, such as hiking, skiing, and exploring the national park. Vacation rental properties in the area include cabins, lodges, and chalets. Gatlinburg has a variety of restaurants, shopping centers, and entertainment venues. Savannah, Georgia Savannah, Georgia, is a charming city filled with historic architecture, parks, and museums. Visitors can enjoy ghost tours, riverboat cruises, and southern cuisine. Vacation rental properties in Savannah include apartments, townhouses, and historic homes. The city also has a variety of restaurants, shopping centers, and entertainment venues. Asheville, North Carolina Asheville, North Carolina, is located in the Blue Ridge Mountains and offers visitors a mix of outdoor activities, such as hiking and biking, as well as cultural attractions, such as art galleries and music venues. Vacation rental properties in Asheville include condos, cabins, and homes. The Importance Of Location: Where Paradise Meets Profit Imagine a place with blue-green water, beautiful beaches, and lots of people visiting all the time. The importance of location cannot be stressed enough when it comes to owning a vacation rental property or investing in Gulf Shores AL homes for sale. Gulf Shores, AL is a place where paradise and profit intersect perfectly. Known for its breathtaking Gulf Coast beaches and warm Southern hospitality, Gulf Shores is a haven for vacationers seeking sun-soaked getaways. Did you know that Gulf Shores, AL has many beautiful properties available? From charming beachfront cottages to luxurious waterfront villas and contemporary condos, there's something to suit every taste and budget. Now, let's dive deeper into the factors you should consider before taking the plunge into the world of vacation rental property ownership. Factors To Consider Before Buying: The Keys To Success Before you search for the best places to own a vacation rental property in Gulf Shores AL or any other vacation destination, it's crucial to consider a few key factors that can make or break your investment. Let's explore these essential considerations: Local Regulations and Zoning Laws: It's important to understand the local regulations, zoning laws, and restrictions in Gulf Shores, AL, before purchasing a property. This includes researching short-term rental restrictions, building codes, and permit requirements. Failure to comply with these regulations could lead to legal issues and fines. Market Trends and Rental Demand: Analyzing market trends, rental demand, and occupancy rates are crucial when considering purchasing houses for sale in Gulf Shores, AL. Research the local rental market, competition, and the demographics of tourists who typically visit the area to estimate the potential income you can earn from your vacation rental property. Financial Planning: Carefully plan your finances to determine what you can afford. Consider all expenses related to the property acquisition, including the down payment, mortgage payments, property taxes, insurance, utilities, and maintenance costs. Additionally, consider the potential need for renovations or upgrades to attract more renters and increase rental income. Property Management: Decide whether you'll manage the property yourself or enlist the services of a professional property management company. Managing a vacation rental can be time-consuming, so it's worth exploring the benefits of outsourcing day-to-day operations. Consider hiring a professional property management firm to handle tasks such as advertising, booking, cleaning, and maintenance. You can visit https://theshorttermshop.com/gulf-shores/ for more information. Alternatively, you can manage the property yourself, but this requires more effort and attention to detail. How To Choose The Best Places To Buy: Unlocking The Treasure Map Now that you're equipped with the knowledge of essential factors to consider, let's embark on a quest to choose the best places to buy your vacation rental property. Here's a treasure map to guide you: Research, Research, Research Unleash your inner adventurer and dive into extensive research. Explore vacation hotspots and identify regions with high rental demand and steady tourist traffic. Utilizing vacation rental websites such as Airbnb, HomeAway, and TripAdvisor can help you find properties that are available in the area. They also provide useful insights into the local rental market, including average rental rates and occupancy rates. Additionally, these websites make it easier to promote your property among potential visitors. Proximity To Attractions And Amenities X marks the spot! Look for locations that offer easy access to popular attractions, such as beaches, amusement parks, cultural landmarks, and outdoor recreational activities. Additionally, proximity to amenities like shopping centers, restaurants, and entertainment venues can enhance the appeal of your rental property. For instance, if you are looking for Gulf Shores AL luxury homes for sale, consider locations like Gulf State Park and Little Lagoon, which offer a range of popular activities. Local Real Estate Experts Seek the guidance of local real estate agents or short-term rental experts who have an intimate understanding of the market. Their knowledge and expertise can prove invaluable in guiding your decision-making process. They can help you find ideal Gulf Shores AL condos for sale or houses for sale in Gulf Shores AL, depending on your budget and preferences. Evaluate Potential Properties As you sail through your search, scrutinize potential properties based on their rental potential, condition, and growth prospects. Consider factors such as property size, amenities, views, and overall appeal to attract vacationers seeking unforgettable experiences. If you're considering buying houses for sale in Gulf Shores AL and using it as a vacation rental property, maximizing your ROI is likely a top priority. The Role of Full-Service Acquisition Firms: Your Trusted Shipmates If the thought of navigating the choppy waters of property acquisition and management seems daunting, fear not! Full-service property acquisition firms are here to save the day. These experienced professionals can help you sail smoothly from the initial property search to the day-to-day management of your vacation rental property. Fun Fact: According to our 2021 Vacation Rental Buyer Report, a whopping 42% of buyers looking to purchase a vacation home chose a beach destination as their preferred market type. The allure of beachfront escapes has captivated investors and for good reason! When you team up with a full-service firm, you gain access to a crew of experts who can handle everything from finding your dream property to managing it with utmost care. They'll save you time, and hassle, and provide you with peace of mind, knowing that your investment is in capable hands. These firms have a proven track record of success and can unlock the hidden potential of your vacation rental property. To maximize your ROI with a beachfront or waterfront property in Gulf Shores, it's important to work with a reputable full-service short-term rental acquisition firm. Such firms have the local expertise and resources to help you find the right property, effectively market it to potential renters, and manage it on a day-to-day basis. Benefits Of Selling Your Home For Cash The journey of purchasing a vacation rental property can be exciting and rewarding, but it's also important to consider strategies for selling your home for cash. Let's explore some benefits of selling your home for cash: Quick Closing Process: Selling your home for cash eliminates many of the steps associated with a traditional sale, such as appraisals and inspections. This allows you to close the sale quickly and get the cash you need in a timely manner. Save on Closing Costs: Selling your home for cash often involves fewer fees and costs than the traditional route, which can save you money in the long run. Avoid Home Repairs: Selling your home for cash means you don't have to invest time or effort into repairs or upgrades before the sale. This means you can avoid the hassle of dealing with costly projects and get your cash quickly. Flexible Terms: Selling your home for cash provides you with more flexibility when it comes to the terms and conditions of the sale. You can negotiate better deals that may include extended closing dates, flexible payment plans, or other terms that work in your favor. Your Voyage Begins Here! Congratulations on starting your exciting journey to discover the top houses for sale in Gulf Shores AL. By understanding the importance of location, considering crucial factors before buying, and learning how to choose the best destinations, you're well on your way to success. Whether you set your sights on Gulf Shores AL waterfront homes for sale, or any other captivating locale, the key lies in thorough research and smart decision-making. So, weigh anchor and set sail toward your dream Gulf Shores AL real estate property! Remember, you can chart your course independently or enlist the expertise of a full-service acquisition firm to guide you through the process. Whichever path you choose, the promise of incredible experiences, financial gains, and unforgettable memories awaits. Read Also: How To Start A Logistics Company? An Expert Guide Biggest Stock Market Crashes In The World History 10 Best Investment Apps For 2021
Jul 07, 2023
ACTC Stock – Present Price, Forecast, Statistics – Should You Invest In It In 2022?
Are you looking for the most accurate analysis of ACTC stock? Then you are at the right place. This guide is dedicated to all those audiences who are planning to invest or have already invested in ACTC. So stay tuned with us and read till the end to get the answer of the question you are searching for - Is ACTC Stock A Worthy Investment Option In 2022? What Is ACTC Stock? The Background ACTC Stock or ArcLight Clean Transition Stock comes from the company named ACTC based in Alexandria, United State. It’s a part of the Offices of Physicians Industry. Believe it or not, it has a total number of 3 employees across all its locations and generates $72,282 in sales (USD). What Happened To ACTC Stock? In the early days of 2021, several speculations were hovering about the ACTC merger. So basically, ArcLight Clean Transition was supposed to be renamed Proterra in the first half of 2021 with a new symbol of PTRA. And it happened as well successfully. The organization did a prestigious job of presenting the prospects and financial forecasts in one of its business presentations. Current Price Of ACTC Stock The present ACTC stock price, which is on April 21, 2022, is USD $ 16.490. Prediction Of ACTC Stock Price The segment below presents the ACTC stock forecast with both historical data and future predictions. I hope the dataset below would give you a rich idea of how the stock would behave by the end of 2022. Take a look. 1. Historical Data DateOpening priceClosing priceMinimum priceMaximum price2021-06-15Open: 16.940Close: 16.940Low: 16.940High: 16.9402021-06-14Open: 18.748Close: 18.748Low: 18.748High: 18.7482021-06-11Open: 18.951Close: 18.951Low: 18.951High: 18.9512021-06-10Open: 18.782Close: 18.782Low: 18.782High: 18.7822021-06-09Open: 18.963Close: 18.963Low: 18.963High: 18.9632021-06-08Open: 18.956Close: 18.956Low: 18.956High: 18.9562021-06-07Open: 18.917Close: 18.917Low: 18.917High: 18.9172021-06-04Open: 18.867Close: 18.867Low: 18.867High: 18.8672021-06-03Open: 18.723Close: 18.723Low: 18.723High: 18.7232021-06-02Open: 19.093Close: 19.093Low: 19.093High: 19.0932021-06-01Open: 18.518Close: 18.518Low: 18.518High: 18.5182021-05-28Open: 17.698Close: 17.698Low: 17.698High: 17.6982021-05-27Open: 17.106Close: 17.106Low: 17.106High: 17.1062021-05-26Open: 16.601Close: 16.601Low: 16.601High: 16.601Source: https://walletinvestor.com/stock-forecast/actc-stock-prediction Analysis: From the historical price chart of ACTC Stock Proterra above, you can see a dataset of 20221. From 26th May 2021 to 15th June 2021, the opening price, closing price, maximum and minimum price are found to be on an increasing trend. This indicates a long-term profit potential of Arclight Clean Transition Corp Stock. 2. Predicted Future Data May 202226.44128.27426.44128.2746.48 % ▲June 202228.24329.18627.57529.1863.23 % ▲July 202229.37430.28128.48130.2812.99 % ▲August 202229.38831.19029.38831.2215.78 % ▲September 202231.22632.32130.52132.3213.39 % ▲October 202231.42832.33531.42833.2282.8 % ▲November 202233.26134.13732.56134.1672.57 % ▲December 202234.17335.26833.46835.2683.11 % ▲Source: https://walletinvestor.com/stock-forecast/actc-stock-prediction Analysis: The monthly ACTC stock forecast table above indicates that the price is going to rise from May 2022 to December 2022. So, that’s also a positive aspect of ACTC which indicates its growth potential. 52 Week High And Low Of ACTC Stock Price The 52-week high and low values of ACTC Stock Proterra are here. I have given both historical and forecast values so that you get a clear idea of the yearly trading difference. 1. Historical Data 52 Week High52 Week LowUSD $31.06USD $9.7 2. Predicted Future Data 52 Week High52 Week LowUSD $28.733USD $16.241 How ACTC Stock Is Going To Perform By 2027 Source: https://walletinvestor.com/stock-forecast/actc-stock-prediction Analysis: The diagram above denotes that ACTC Stock price is going to rise from April 2023 to April 2016 at a steady rate. ACTC stock forecast 2025 and 2026 is sufficient enough to make you understand how prosperous the long-term earning potential is. Frequently Asked Questions (FAQs) Q1. What Is The ACTC Stock Price Today? Ans: The ACTC Stock or Arclight Clean Transition Corp Stock price is USD $16.940. Q2. Will ACTC Stock Price Go Up? Ans: Yes, the ACTC Stock price could go up from USD $16.940 to USD $28.733 USD in a single year. Q3. Is It Profitable To Invest In ACTC Stock? Ans: According to ACTC Stock Forecast, the long-term earning potential is +69.61% in a single year. Q4. What Will Be ACTC Stock Price In 5 Years? Ans: As per ACTC Stock Forecast, the expected ACTC Stock price within the coming 5 years is USD $76.070. Is ACTC Stock A Good Buy? That’s all about ACTC Stock Proterra. It’s quite evident from the stock ACTC review that it's definitely investment-worthy. Due to a high long-term earning potential, you can expect better profits by 2025. It’s noteworthy that after the ACTC Stock merger, its performance has gone up. Hence, there are considerable chances of ROI in the future. Have Any more queries on it? Let’s meet in the comment section. For more similar reviews on stocks like this, stay tuned with us. Disclaimer: Respected Readers, the ACTC Stock price facts, and the data we presented above are all assumptions. All the data refers to those present on the leading cryptomarket websites. The actual values might be different on the basis of the market situation. Please note that share/stock prices are subject to market risks. Read all the documents and examine them carefully before investing. Read Also: BNKU Stock: MicroSectors US Big Banks Index 3X Leveraged ETNsTUI Share Price Forcast: Everything You Should KnowPooCoin Stock Forecast: Everything You Should Know
Jun 29, 2022
EUA Share Price Forecast: Everything You Should Know
Buying shares in the share market can be a risky business. This is because the share price that you bought might fall the next day. If you sell it, then you will suffer losses. However, if you sell it at a higher margin, you will profit. Similarly, knowing the current EUA share price will help you make the best decision for buying an EUA share. Therefore, in this article, you will get to learn more about Eurasia Mining and its share prices so that you can go for the best investment opportunity. What Is Eurasia Mining? Eurasia Mining PLC is a British international mineral exploration and mining company. Even though it is based in Britain, most of its mining activities are centered in Russia. The company mainly mines for resources like Gold, Platinum Group Minerals (PGM) like Iridium and Rhodium, Copper, and other minerals. The company was formed in 1996 and had its name in the Alternative Investment Market list in the same year. However, the company gained popularity after it discovered Monchetundra, a palladium-driven mine near the Russian town of Monchegorsk. Eurasia Mining Projects If you want to decide whether or not to invest in shares of Eurasia, you need to know about its operations first. Currently, it has three active mining operations. They are: 1. Monchetundra Monchetundra is an open-pit mine near Monchegorsk, which is near the border of Finland. The EPC contract and financial services are provided by the Chinese company Sinosteel. Along with the open-pit mines, many flanks exist alongside the Monchetundra license. These include targets like the NTF Massif and control over various extensions of the Loipishnune ores. Monchetundra is a palladium-rich flagship open-pit mine containing rich palladium deposits, plutonium, copper, and nickel. The costs for mining these ores are lower than average because Sinosteel partly finances them through EPCF. 2. Rosgeo JV Projects Eurasia has formed a 15-year joint venture with Rosgeo, Russia's biggest geological holding company. This venture is also supported by the company Anglo American Platinum. Because of this joint venture, Eurasia has the only PGM mining permit in the region. This project aims to transform the company into a major distributor and producer of PGM and battery metals. Therefore, this joint venture is set up to allow Eurasia to gradually take control of 75% equity stakes of nine PGM and battery metals assets. This joint venture allows Eurasia to control four different palladium, nickel, platinum, and cobalt deposit ores in the Monchetundra region. Later on, EUA will also have green signals for mining and developing five other pits of palladium, platinum, copper, nickel, and cobalt. 3. West Kytlim A new addition to the assets of EUA includes this sustainable mining facility in West Kytlim PGM and Gold mines. The long-term goal of this project is to reduce carbon emissions from mining operations. The goal of sustainability is only possible because of the reduced use of reinforced concrete and asphalt. Its main objective is to mill timber available on site. Due to its focus on sustainability, modern machinery and renewable electricity are applied 24/7. The rivers of this region are dug for free, with their alluvial sediments transported using a washplant. EUA Share Price The forecast of the Share Price EUA live from November 2021 to February 2022 is given below: According to market reports published by Eurasia PLC, the company's market capitalization is estimated to be $123.97 million, with total assets worth $20.06 million. The company has seen growth in its total revenue earned. This can be understood by the fact that the firm's total revenue was $1.3 million in the year 2020. This amount jumped to $1.6 million by the end of 2021. Latest Key Revenue Details: Recent Revenue: £6.64 million (December 31, 2024, Year ending) Previous Year: £0.12 million (December 31, 2022, Year ending) Quarterly Revenue Growth: 220.70% Sector: Precious Metals However, the EUA share price story is entirely different from this calculation. According to EUA share price chat, Eurasia Mining's stock price was valued at GBX (Great Britain Pence) of 0.07, which amounts to $0.095 in March 2020 before the spread of the COVID pandemic. Since then, the price of its shares has increased by 27.5%; it is valued at 19.6GBX. However, the stock prices of the company are currently volatile. This is evident by its movement or daily average volatility rate of 9.84% throughout the last week. Its share prices also fell recently from 0.22GBX to 19.6GBX on a single day (Thursday, 17th February). During this day alone, its stock prices fell by 5.10%. However, the volume of shares sold increased by 4 million, even while the Eurasia share price was still falling. This is an indication of risk for the share buyers. But this is all just speculation since the market is volatile and constantly changing. Also Read: What Is IPO (Initial Public Offering) Stock And How To Buy It? Eurasia Mining News If you are new to the share market, you should know that the EUA share price increases and decreases depending on the latest company news and their financial performance. While the Monchetundra facility might still be far from production, Rosgeo pays all the drilling expenses. The EUA has also raised a lot of funds to aid Rosegeo in the mining process. The latest news about Eurasia indicates that the company has sold 41.5 million shares to investors, requesting buyers to buy another 41.5 million shares. This is done to generate an influx of cash available to the company for all its mining operations. Should You Buy EUA Stock? The Monchetundra project is still far from production. This is because the project is still in its mining phase. It will then proceed to the refining stage and finally to the production and distribution phase, where the minerals will be available for sale to investors and buyers. Therefore, we expect the company to reach its production stage in approximately two years. Given the trend of the value of the EUA share price falling every day, we recommend that you not buy its shares for the time being. This is because we expect the prices of Eurasia mining shares to drop more in the next few weeks, as predicted due to its downward trend. However, this does not mean that EUA has no market potential. On the contrary, as soon as its projects hit production phases, the EUA share price will increase from 30 GBX by the end of 2023 to probably 71 GBX by 2027. Therefore, the company has a lot of potential for profitability, but not yet. Also Read: What Is SHLL? Is SHLL A Good Stock? Frequently Asked Questions (FAQs) [su_spoiler title="Q1. Why Is Eurasia Mining Suspended?" open="yes" style="default" icon="plus" anchor="" anchor_in_url="no" class=""]The EUA share prices were suspended temporarily to clarify their relationship with Chinese investment company CITIC Group Corp.[/su_spoiler] [su_spoiler title="Q2. Who Is Buying Eurasia Mining Shares?" open="yes" style="default" icon="plus" anchor="" anchor_in_url="no" class=""]Eurasia signed a deal with Rosgeo that allows EUA to take over 75% equity shares of all the nine mines in Monchetundra and West Kytlim.[/su_spoiler] [su_spoiler title="Q3. Is Eurasia Mining A Good Investment?" open="yes" style="default" icon="plus" anchor="" anchor_in_url="no" class=""]For the time being, due to a trend of EUA share price dropping every day, we do not recommend investing in Eurasia Mining.[/su_spoiler] [su_spoiler title="Q4. How Do I Buy Eurasia Mining Shares?" open="yes" style="default" icon="plus" anchor="" anchor_in_url="no" class=""]To buy their shares, you need to register an account with a trading platform.[/su_spoiler] Conclusion Eurasia is a mining company based in the UK. However, most of its mining operations take place in Russia because of the rich concentration of PGM. While their Monchetundra project is still in its developmental phase, it focuses on mining for the time being. However, it will start producing refined minerals in approximately 2-3 years. Therefore, the EUA share price is decreasing in a downward trend. However, we expect the cost of the shares to rise when production starts. But we do not recommend buying its shares for the time being since they pose a high-risk value for the time being. #Disclaimer: The information provided on this blog is for educational and informational purposes only and should not be construed as financial advice. I am not a licensed financial advisor. Any investment decision you make is at your own risk, and you should consult with a qualified financial advisor before making any investment decisions. This site may contain affiliate links, and I may earn a commission at no additional cost to you. More Resources: Is MAX Stock A Good Buy? Everything You Should Know Should You Buy GMER Stock? Everything You Should Know Is Twitch Stock Worth Buying Now? Everything You Should Know
Feb 22, 2022